mirror of
https://github.com/graphql-hive/console
synced 2026-04-21 14:37:17 +00:00
3089 lines
102 KiB
Text
3089 lines
102 KiB
Text
---
|
|
description:
|
|
Monitoring and tracing are essential for debugging and understanding the performance and overall
|
|
behavior of your Hive Gateway.
|
|
---
|
|
|
|
import Image from 'next/image'
|
|
import { Table, Td, Th, Tr } from 'nextra/components'
|
|
import { Callout, Cards, Tabs } from '@theguild/components'
|
|
|
|
# Monitoring and Tracing
|
|
|
|
If something is not working as it should within your GraphQL gateway, you would not want it to go
|
|
unnoticed.
|
|
|
|
Monitoring and tracing are essential for debugging and understanding the performance of your
|
|
gateway.
|
|
|
|
You can use Gateway plugins to trace and monitor your gateway's execution flow together with all
|
|
outgoing HTTP calls and internal query planning.
|
|
|
|
## Healthcheck
|
|
|
|
Hive Gateway is aware of the usefulness of a health check and gives the user maximum possibilities
|
|
to use the built-in check.
|
|
|
|
There are two types of health checks: **liveliness** and **readiness**, they both _are_ a health
|
|
check but convey a different meaning:
|
|
|
|
- **Liveliness** checks whether the service is alive and running
|
|
- **Readiness** checks whether the upstream services are ready to perform work and execute GraphQL
|
|
operations
|
|
|
|
The difference is that a service can be _live_ but not _ready_ - for example, server has started and
|
|
is accepting requests (alive), but the read replica it uses is still unavailable (not ready).
|
|
|
|
Both endpoints are enabled by default.
|
|
|
|
### Liveliness
|
|
|
|
By default, you can check whether the gateway is alive by issuing a request to the `/healthcheck`
|
|
endpoint and expecting the response `200 OK`. A successful response is just `200 OK` without a body.
|
|
|
|
You can change this endpoint through the `healthCheckEndpoint` option:
|
|
|
|
<Tabs items={['CLI', "Programmatic Usage"]}>
|
|
|
|
<Tabs.Tab>
|
|
|
|
```ts filename="gateway.config.ts"
|
|
import { defineConfig } from '@graphql-hive/gateway'
|
|
|
|
export const gatewayConfig = defineConfig({
|
|
healthCheckEndpoint: '/healthcheck'
|
|
})
|
|
```
|
|
|
|
</Tabs.Tab>
|
|
|
|
<Tabs.Tab>
|
|
|
|
```ts filename="index.ts"
|
|
import { createGatewayRuntime } from '@graphql-hive/gateway-runtime'
|
|
|
|
export const gateway = createGatewayRuntime({
|
|
healthCheckEndpoint: '/healthcheck'
|
|
})
|
|
```
|
|
|
|
</Tabs.Tab>
|
|
|
|
</Tabs>
|
|
|
|
### Readiness
|
|
|
|
For readiness check, Hive Gateway offers another endpoint (`/readiness`) which checks whether the
|
|
services powering your gateway are ready to perform work. It returns `200 OK` if all the services
|
|
are ready to execute GraphQL operations.
|
|
|
|
It returns `200 OK` if all the services are ready to perform work.
|
|
|
|
You can customize the readiness check endpoint through the `readinessCheckEndpoint` option:
|
|
|
|
<Tabs items={['CLI', "Programmatic Usage"]}>
|
|
|
|
<Tabs.Tab>
|
|
|
|
```ts filename="gateway.config.ts"
|
|
import { defineConfig } from '@graphql-hive/gateway'
|
|
|
|
export const gatewayConfig = defineConfig({
|
|
readinessCheckEndpoint: '/readiness'
|
|
})
|
|
```
|
|
|
|
</Tabs.Tab>
|
|
|
|
<Tabs.Tab>
|
|
|
|
```ts filename="index.ts"
|
|
import { createGatewayRuntime } from '@graphql-hive/gateway-runtime'
|
|
|
|
export const gateway = createGatewayRuntime({
|
|
readinessCheckEndpoint: '/readiness'
|
|
})
|
|
```
|
|
|
|
</Tabs.Tab>
|
|
|
|
</Tabs>
|
|
|
|
## OpenTelemetry Traces
|
|
|
|
Hive Gateway supports OpenTelemetry for tracing and monitoring your gateway.
|
|
|
|
[OpenTelemetry](https://opentelemetry.io/) is a set of APIs, libraries, agents, and instrumentation
|
|
to provide observability to your applications.
|
|
|
|
The following are available to use with this plugin:
|
|
|
|
- HTTP request: tracks the incoming HTTP request and the outgoing HTTP response
|
|
- GraphQL Lifecycle tracing: tracks the GraphQL execution lifecycle (parse, validate and execution).
|
|
- Upstream HTTP calls: tracks the outgoing HTTP requests made by the GraphQL execution.
|
|
- Context propagation: propagates the trace context between the incoming HTTP request and the
|
|
outgoing HTTP requests.
|
|
- Custom Span and attributes: Add your own business spans and attributes from your own plugin.
|
|
- Logs and Traces correlation: Rely on standard OTEL shared context to correlate logs and traces
|
|
|
|

|
|
|
|
### OpenTelemetry Setup
|
|
|
|
For the OpenTelemetry tracing feature to work, OpenTelemetry JS API must be setup.
|
|
|
|
We recommend to place your OpenTelemetry setup in a `telemetry.ts` file that will be your first
|
|
import in your `gateway.config.ts` file. This allow instrumentations to be registered (if any)
|
|
before any other packages are imported.
|
|
|
|
For ease of configuration, we provide a `openTelemetrySetup` function from
|
|
`@graphql-hive/plugin-opentelemetry/setup` module, with sensible default and straightforward API
|
|
compatible with all runtimes.
|
|
|
|
But this utility is not mandatory, you can use any setup relevant to your specific use case and
|
|
infrastructure.
|
|
|
|
The most commonly used otel packages are available when using Hive Gateway with CLI. Please switch
|
|
to programmatic usage if you need more packages.
|
|
|
|
Please refer to [`opentelemetry-js` documentation](https://opentelemetry.io/docs/languages/js/) for
|
|
more details about OpenTelemetry setup and API.
|
|
|
|
#### Basic usage
|
|
|
|
<Tabs items={[<div>Hive Gateway <code>openTelemetrySetup()</code> (recommended)</div>, <div>OpenTelemetry <code>NodeSDK</code></div>, "CLI"]}>
|
|
|
|
<Tabs.Tab>
|
|
|
|
This configuration API still rely on official `@opentelemetry/api` package, which means you can use
|
|
any official or standard compliant packages with it.
|
|
|
|
You will have to pick a
|
|
[Context Manager](https://opentelemetry.io/docs/languages/js/context/#context-manager) (we recommend
|
|
to use `AsyncLocalStorageContextManager` from `@opentelemetry/context-async-hooks` if your runtime
|
|
supports `AsyncLocalStorage` API), and a trace exporter depending on your traces backend (probably
|
|
`@opentelemetry/exporter-trace-otlp-http`).
|
|
|
|
```sh npm2yarn
|
|
npm i @opentelemetry/context-async-hooks @opentelemetry/exporter-trace-otlp-http
|
|
```
|
|
|
|
```ts filename="telemetry.ts"
|
|
import { openTelemetrySetup } from '@graphql-hive/gateway/opentelemetry/setup'
|
|
import { AsyncLocalStorageContextManager } from '@opentelemetry/context-async-hooks'
|
|
import { OTLPTraceExporter } from '@opentelemetry/exporter-trace-otlp-http'
|
|
|
|
openTelemetrySetup({
|
|
// Mandatory: It depends on the available API in your runtime.
|
|
// We recommend AsyncLocalStorage based manager when possible.
|
|
// `@opentelemetry/context-zone` is also available for other runtimes.
|
|
// Pass `false` to disable context manager usage.
|
|
contextManager: new AsyncLocalStorageContextManager(),
|
|
|
|
traces: {
|
|
// Define your exporter, most of the time the OTLP HTTP one. Traces are batched by default.
|
|
exporter: new OTLPTraceExporter({ url: process.env['OTLP_URL'] }),
|
|
|
|
// You can easily enable a console exporter for quick debug
|
|
console: process.env['DEBUG_TRACES'] === '1'
|
|
}
|
|
})
|
|
```
|
|
|
|
After configuring and setting up the telemetry, make sure to import it as the first import in your
|
|
`gateway.config.ts` file and enable OpenTelemetry tracing:
|
|
|
|
```ts filename="gateway.config.ts"
|
|
import './telemetry'
|
|
import { defineConfig } from '@graphql-hive/gateway'
|
|
|
|
export const gatewayConfig = defineConfig({
|
|
openTelemetry: {
|
|
traces: true
|
|
}
|
|
})
|
|
```
|
|
|
|
</Tabs.Tab>
|
|
|
|
<Tabs.Tab>
|
|
|
|
<Callout>
|
|
Official OpenTelemetry Node SDK is only working when Hive Gateway is used via the CLI or
|
|
programmatically with a Node runtime.
|
|
</Callout>
|
|
|
|
OpenTelemetry provides an official SDK for Node (`@opentelemetry/sdk-node`). This SDK offers a
|
|
standard API compatible with OTEL SDK specification. You will also need an exporter depending on
|
|
your traces backend (probably `@opentelemetry/exporter-trace-otlp-http`)
|
|
|
|
```sh npm2yarn
|
|
npm i @opentelemetry/sdk-node @opentelemetry/exporter-trace-otlp-http
|
|
```
|
|
|
|
It ships with a lot of features, most of them being configurable via environment variables.
|
|
|
|
The most commonly used otel packages are available when using Hive Gateway with CLI, which means you
|
|
can follow official `@opentelemetry/sdk-node` documentation for your setup. Please switch to
|
|
programmatic usage if you need more packages.
|
|
|
|
```ts filename="telemetry.ts"
|
|
import { OTLPTraceExporter } from '@opentelemetry/exporter-trace-otlp-http'
|
|
import { NodeSDK, resources, tracing } from '@opentelemetry/sdk-node'
|
|
|
|
new NodeSDK({
|
|
// All configuration is optional. OTEL rely on env variables or sensible default value.
|
|
|
|
// Defines the exporter, HTTP OTLP most of the time. Traces are batched by default
|
|
traceExporter: new OTLPTraceExporter({ url: process.env['OTLP_URL'] }),
|
|
|
|
// Optional, enables automatic instrumentation, adding traces like network spans.
|
|
instrumentations: getNodeAutoInstrumentations(),
|
|
|
|
// Optional, enables automatic resource attributes detection
|
|
resourceDetectors: getResourceDetectors()
|
|
}).start()
|
|
```
|
|
|
|
After configuring and setting up the telemetry, make sure to import it as the first import in your
|
|
`gateway.config.ts` file and enable OpenTelemetry tracing:
|
|
|
|
```ts filename="gateway.config.ts"
|
|
import './telemetry'
|
|
import { defineConfig } from '@graphql-hive/gateway'
|
|
|
|
export const gatewayConfig = defineConfig({
|
|
openTelemetry: {
|
|
traces: true
|
|
}
|
|
})
|
|
```
|
|
|
|
</Tabs.Tab>
|
|
|
|
<Tabs.Tab>
|
|
|
|
If your use case is simple enough, you can use CLI options to setup OpenTelemetry.
|
|
|
|
```bash
|
|
hive-gateway supergraph supergraph.graphql \
|
|
--opentelemetry "http://localhost:4318"
|
|
```
|
|
|
|
By default, an HTTP OTLP exporter will be used, but you can change it with
|
|
`--opentelemetry-exporter-type`:
|
|
|
|
```bash
|
|
hive-gateway supergraph supergraph.graphql \
|
|
--opentelemetry "http://localhost:4317" \
|
|
--opentelemetry-exporter-type otlp-grpc
|
|
```
|
|
|
|
Please refer to `openTelemetrySetup()` usage if you need more control and options.
|
|
|
|
</Tabs.Tab>
|
|
|
|
</Tabs>
|
|
|
|
#### Service name and version
|
|
|
|
You can provide a service name, either by using standard `OTEL_SERVICE_NAME` and
|
|
`OTEL_SERVICE_VERSION` or by providing them programmatically via setup options
|
|
|
|
<Tabs items={[<div>Hive Gateway <code>openTelemetrySetup()</code> (recommended)</div>, <div>OpenTelemetry <code>NodeSDK</code></div>]}>
|
|
|
|
<Tabs.Tab>
|
|
|
|
```ts filename="telemetry.ts"
|
|
import { openTelemetrySetup } from '@graphql-hive/gateway/opentelemetry/setup'
|
|
|
|
openTelemetrySetup({
|
|
resource: {
|
|
serviceName: 'my-service',
|
|
serviceVersion: '1.0.0'
|
|
}
|
|
})
|
|
```
|
|
|
|
</Tabs.Tab>
|
|
|
|
<Tabs.Tab>
|
|
|
|
```ts filename="telemetry.ts"
|
|
import { NodeSDK, resources } from '@opentelemetry/sdk-node'
|
|
|
|
new NodeSDK({
|
|
resource: resources.resourceFromAttributes({
|
|
'service.name': 'my-service',
|
|
'service.version': '1.0.0'
|
|
})
|
|
}).start()
|
|
```
|
|
|
|
</Tabs.Tab>
|
|
|
|
</Tabs>
|
|
|
|
#### Custom resource attributes
|
|
|
|
Resource attributes can be defined by providing a `Resource` instance to the setup `resource`
|
|
option.
|
|
|
|
<Tabs items={[<div>Hive Gateway <code>openTelemetrySetup()</code> (recommended)</div>, <div>OpenTelemetry <code>NodeSDK</code></div>]}>
|
|
|
|
<Tabs.Tab>
|
|
|
|
This resource will be merged with the resource created from env variables, which means
|
|
`service.name` and `service.version` are not mandatory if already provided through environment
|
|
variables.
|
|
|
|
```sh npm2yarn
|
|
npm i @opentelemetry/resources
|
|
```
|
|
|
|
```ts filename="telemetry.ts"
|
|
import { openTelemetrySetup } from '@graphql-hive/gateway/opentelemetry/setup'
|
|
import { resourceFromAttributes } from '@opentelemetry/resources'
|
|
|
|
openTelemetrySetup({
|
|
resource: resourceFromAttributes({
|
|
'custom.attribute': 'my custom value'
|
|
})
|
|
})
|
|
```
|
|
|
|
</Tabs.Tab>
|
|
|
|
<Tabs.Tab>
|
|
|
|
```ts filename="telemetry.ts"
|
|
import { NodeSDK, resources } from '@opentelemetry/sdk-node'
|
|
|
|
new NodeSDK({
|
|
resource: resources.resourceFromAttributes({
|
|
'service.name': 'my-service',
|
|
'service.version': '1.0.0'
|
|
})
|
|
}).start()
|
|
```
|
|
|
|
</Tabs.Tab>
|
|
|
|
</Tabs>
|
|
|
|
#### Trace Exporter, Span Processors and Tracer Provider
|
|
|
|
Exporters are responsible of storing the traces recorded by OpenTelemetry. There is a large existing
|
|
range of exporters, Hive Gateway is compatible with any exporter using `@opentelemetry/api` standard
|
|
OpenTelemetry implementation.
|
|
|
|
Span Processors are responsible of processing recorded spans before they are stored. They generally
|
|
take an exporter in parameter, which is used to store processed spans.
|
|
|
|
Tracer Provider is responsible of creating Tracers that will be used to record spans.
|
|
|
|
You can setup OpenTelemetry by providing either:
|
|
|
|
- a Trace Exporter. A Span processor and a Tracer Provider will be created for you, with sensible
|
|
production defaults like trace batching.
|
|
- a list of Span Processors. This gives you more control, and allows to define more than one
|
|
exporter. The Tracer Provider will be created for you.
|
|
- a Tracer Provider. This is the manual setup mode where nothing is created automatically. The
|
|
Tracer Provider will just be registered.
|
|
|
|
<Tabs items={[<div>Hive Gateway <code>openTelemetrySetup()</code> (recommended)</div>, <div>OpenTelemetry <code>NodeSDK</code></div>]}>
|
|
|
|
<Tabs.Tab>
|
|
|
|
```ts filename="telemetry.ts"
|
|
import { openTelemetrySetup } from '@graphql-hive/gateway/opentelemetry/setup'
|
|
import { AsyncLocalStorageContextManager } from '@opentelemetry/context-async-hooks'
|
|
|
|
openTelemetrySetup({
|
|
contextManager: new AsyncLocalStorageContextManager(),
|
|
traces: {
|
|
// Define your exporter, most of the time the OTLP HTTP one. Traces are batched by default.
|
|
exporter: ...,
|
|
|
|
// To ease debug, you can also add a non-batched console exporter easily with `console` option
|
|
console: true,
|
|
},
|
|
})
|
|
|
|
// or
|
|
|
|
openTelemetrySetup({
|
|
contextManager: new AsyncLocalStorageContextManager(),
|
|
traces: {
|
|
// Define your span processors.
|
|
processors: [...],
|
|
},
|
|
})
|
|
|
|
// or
|
|
|
|
openTelemetrySetup({
|
|
contextManager: new AsyncLocalStorageContextManager(),
|
|
traces: {
|
|
// Define your span processors.
|
|
tracerProvider: ...,
|
|
},
|
|
})
|
|
```
|
|
|
|
</Tabs.Tab>
|
|
|
|
<Tabs.Tab>
|
|
|
|
```ts filename="telemetry.ts"
|
|
import { NodeSDK } from '@opentelemetry/sdk-node'
|
|
|
|
new NodeSDK({
|
|
// Define your exporter, most of the time the OTLP HTTP one. Traces are batched by default.
|
|
traceExporter: ...,
|
|
}).start()
|
|
|
|
// or
|
|
|
|
new NodeSDK({
|
|
// Define your processors
|
|
spanProcessors: [...],
|
|
}).start()
|
|
```
|
|
|
|
OpenTelemetry's `NodeSDK` doesn't allow to manually provide a Tracer Provider. You have to register
|
|
it separately.
|
|
|
|
```ts filename="telemetry.ts"
|
|
import { trace } from '@graphql-hive/gateway/opentelemetry/api'
|
|
import { NodeSDK } from '@opentelemetry/sdk-node'
|
|
|
|
// Manually set the Tracer Provider, NodeSDK will detect that it is already registered
|
|
trace.setGlobalTracerProvider(...)
|
|
|
|
new NodeSDK({
|
|
//...
|
|
}).start()
|
|
```
|
|
|
|
</Tabs.Tab>
|
|
|
|
</Tabs>
|
|
|
|
Hive Gateway CLI embeds every official OpenTelemetry exporters. Please switch manual deployment or
|
|
programmatic usage to install a non-official exporter.
|
|
|
|
<Tabs items={["Stdout", "OTLP (HTTP)", "OTLP (gRPC)", "Jaeger", "NewRelic", "Datadog", "Zipkin"]}>
|
|
|
|
<Tabs.Tab>
|
|
|
|
A simple exporter that writes the spans to the `stdout` of the process. It is mostly used for
|
|
debugging purpose.
|
|
|
|
[See official documentation for more details](https://open-telemetry.github.io/opentelemetry-js/classes/_opentelemetry_sdk-trace-base.ConsoleSpanExporter.html).
|
|
|
|
<Tabs items={[<div>Hive Gateway <code>openTelemetrySetup()</code> (recommended)</div>, <div>OpenTelemetry <code>NodeSDK</code></div>]}>
|
|
|
|
<Tabs.Tab>
|
|
|
|
```ts filename="telemetry.ts"
|
|
import { openTelemetrySetup } from '@graphql-hive/gateway/opentelemetry/setup'
|
|
|
|
openTelemetrySetup({
|
|
contextManager: new AsyncLocalStorageContextManager(),
|
|
traces: {
|
|
console: true
|
|
}
|
|
})
|
|
```
|
|
|
|
</Tabs.Tab>
|
|
|
|
<Tabs.Tab>
|
|
|
|
```ts filename="telemetry.ts"
|
|
import { NodeSDK, tracing } from '@opentelemetry/sdk-node'
|
|
|
|
new NodeSDK({
|
|
// Use `spanProcessors` instead of `traceExporter` to avoid the default batching configuration
|
|
spanProcessors: [new tracing.SimpleSpanProcessor(new tracing.ConsoleSpanExporter())]
|
|
}).start()
|
|
```
|
|
|
|
</Tabs.Tab>
|
|
|
|
</Tabs>
|
|
|
|
</Tabs.Tab>
|
|
|
|
<Tabs.Tab>
|
|
|
|
An exporter that writes the spans to an OTLP-supported backend using HTTP.
|
|
|
|
```sh npm2yarn
|
|
npm i @opentelemetry/exporter-trace-otlp-http
|
|
```
|
|
|
|
<Tabs items={[<div>Hive Gateway <code>openTelemetrySetup()</code> (recommended)</div>, <div>OpenTelemetry <code>NodeSDK</code></div>]}>
|
|
|
|
<Tabs.Tab>
|
|
|
|
```ts filename="telemetry.ts"
|
|
import { openTelemetrySetup } from '@graphql-hive/gateway/opentelemetry/setup'
|
|
import { AsyncLocalStorageContextManager } from '@opentelemetry/context-async-hooks'
|
|
import { OTLPTraceExporter } from '@opentelemetry/exporter-trace-otlp-http'
|
|
|
|
openTelemetrySetup({
|
|
contextManager: new AsyncLocalStorageContextManager(),
|
|
traces: {
|
|
exporter: new OTLPTraceExporter({ url: 'http://<otlp-endpoint>:4318' })
|
|
}
|
|
})
|
|
```
|
|
|
|
</Tabs.Tab>
|
|
|
|
<Tabs.Tab>
|
|
|
|
```ts filename="telemetry.ts"
|
|
import { OTLPTraceExporter } from '@opentelemetry/exporter-trace-otlp-http'
|
|
import { NodeSDK } from '@opentelemetry/sdk-node'
|
|
|
|
new NodeSDK({
|
|
traceExporter: new OTLPTraceExporter({ url: 'http://<otlp-endpoint>:4318' })
|
|
}).start()
|
|
```
|
|
|
|
</Tabs.Tab>
|
|
|
|
</Tabs>
|
|
|
|
</Tabs.Tab>
|
|
|
|
<Tabs.Tab>
|
|
|
|
An exporter that writes the spans to an OTLP-supported backend using gRPC.
|
|
|
|
```sh npm2yarn
|
|
npm i @opentelemetry/exporter-trace-otlp-grpc
|
|
```
|
|
|
|
<Tabs items={[<div>Hive Gateway <code>openTelemetrySetup()</code> (recommended)</div>, <div>OpenTelemetry <code>NodeSDK</code></div>]}>
|
|
|
|
<Tabs.Tab>
|
|
|
|
```ts filename="telemetry.ts"
|
|
import { openTelemetrySetup } from '@graphql-hive/gateway/opentelemetry/setup'
|
|
import { AsyncLocalStorageContextManager } from '@opentelemetry/context-async-hooks'
|
|
import { OTLPTraceExporter } from '@opentelemetry/exporter-trace-otlp-grpc'
|
|
|
|
openTelemetrySetup({
|
|
contextManager: new AsyncLocalStorageContextManager(),
|
|
traces: {
|
|
exporter: new OTLPTraceExporter({ url: 'http://<otlp-endpoint>:4317' })
|
|
}
|
|
})
|
|
```
|
|
|
|
</Tabs.Tab>
|
|
|
|
<Tabs.Tab>
|
|
|
|
```ts filename="telemetry.ts"
|
|
import { OTLPTraceExporter } from '@opentelemetry/exporter-trace-otlp-grpc'
|
|
import { NodeSDK } from '@opentelemetry/sdk-node'
|
|
|
|
new NodeSDK({
|
|
traceExporter: new OTLPTraceExporter({ url: 'http://<otlp-endpoint>:4317' })
|
|
}).start()
|
|
```
|
|
|
|
</Tabs.Tab>
|
|
|
|
</Tabs>
|
|
|
|
</Tabs.Tab>
|
|
|
|
<Tabs.Tab>
|
|
|
|
[Jaeger](https://www.jaegertracing.io/) supports [OTLP over HTTP/gRPC](#otlp-over-http), so you can
|
|
use it by pointing the
|
|
`@opentelemetry/exporter-trace-otlp-http`/`@opentelemetry/exporter-trace-otlp-grpc` to the Jaeger
|
|
endpoint. In the following example, we are using the HTTP exporter.
|
|
|
|
```sh npm2yarn
|
|
npm i @opentelemetry/exporter-trace-otlp-http
|
|
```
|
|
|
|
Your Jaeger instance needs to have OTLP ingestion enabled, so verify that you have the
|
|
`COLLECTOR_OTLP_ENABLED=true` environment variable set, and that ports `4317` and `4318` are
|
|
accessible.
|
|
|
|
<Tabs items={[<div>Hive Gateway <code>openTelemetrySetup()</code> (recommended)</div>, <div>OpenTelemetry <code>NodeSDK</code></div>]}>
|
|
|
|
<Tabs.Tab>
|
|
|
|
```ts filename="telemetry.ts"
|
|
import { openTelemetrySetup } from '@graphql-hive/gateway/opentelemetry/setup'
|
|
import { AsyncLocalStorageContextManager } from '@opentelemetry/context-async-hooks'
|
|
import { OTLPTraceExporter } from '@opentelemetry/exporter-trace-otlp-http'
|
|
|
|
openTelemetrySetup({
|
|
contextManager: new AsyncLocalStorageContextManager(),
|
|
traces: {
|
|
exporter: new OTLPTraceExporter({ url: 'http://<jaeger-endpoint>:4318/v1/traces' })
|
|
}
|
|
})
|
|
```
|
|
|
|
</Tabs.Tab>
|
|
|
|
<Tabs.Tab>
|
|
|
|
```ts filename="telemetry.ts"
|
|
import { OTLPTraceExporter } from '@opentelemetry/exporter-trace-otlp-http'
|
|
import { NodeSDK } from '@opentelemetry/sdk-node'
|
|
|
|
new NodeSDK({
|
|
traceExporter: new OTLPTraceExporter({ url: 'http://<jaeger-endpoint>:4318/v1/traces' })
|
|
}).start()
|
|
```
|
|
|
|
</Tabs.Tab>
|
|
|
|
</Tabs>
|
|
|
|
</Tabs.Tab>
|
|
|
|
<Tabs.Tab>
|
|
|
|
[NewRelic](https://newrelic.com/) supports [OTLP over HTTP/gRPC](#otlp-over-http), so you can use it
|
|
by configuring the
|
|
`@opentelemetry/exporter-trace-otlp-http`/`@opentelemetry/exporter-trace-otlp-grpc` to the NewRelic
|
|
endpoint. In the following example, we are using the HTTP exporter.
|
|
|
|
```sh npm2yarn
|
|
npm i @opentelemetry/exporter-trace-otlp-http
|
|
```
|
|
|
|
Please refer to the
|
|
[NewRelic OTLP documentation](https://docs.newrelic.com/docs/opentelemetry/best-practices/opentelemetry-otlp/#configure-endpoint-port-protocol)
|
|
for complete documentation and to find the appropriate endpoint.
|
|
|
|
<Tabs items={[<div>Hive Gateway <code>openTelemetrySetup()</code> (recommended)</div>, <div>OpenTelemetry <code>NodeSDK</code></div>]}>
|
|
|
|
<Tabs.Tab>
|
|
|
|
```ts filename="telemetry.ts"
|
|
import { openTelemetrySetup } from '@graphql-hive/gateway/opentelemetry/setup'
|
|
import { AsyncLocalStorageContextManager } from '@opentelemetry/context-async-hooks'
|
|
import { OTLPTraceExporter } from '@opentelemetry/exporter-trace-otlp-http'
|
|
|
|
openTelemetrySetup({
|
|
contextManager: new AsyncLocalStorageContextManager(),
|
|
traces: {
|
|
exporter: new OTLPTraceExporter({
|
|
url: 'https://otlp.nr-data.net', // For US users, or https://otlp.eu01.nr-data.net for EU users
|
|
headers: { 'api-key': '<your-license-key>' },
|
|
compression: 'gzip' // Compression is recommended by NewRelic
|
|
}),
|
|
batching: {
|
|
// Depending on your traces size and network quality, you will probably need to tweak batching
|
|
// configuration. A batch should not be larger than 1Mo.
|
|
}
|
|
}
|
|
})
|
|
```
|
|
|
|
</Tabs.Tab>
|
|
|
|
<Tabs.Tab>
|
|
|
|
```ts filename="telemetry.ts"
|
|
import { OTLPTraceExporter } from '@opentelemetry/exporter-trace-otlp-http'
|
|
import { NodeSDK } from '@opentelemetry/sdk-node'
|
|
|
|
new NodeSDK({
|
|
traceExporter: new OTLPTraceExporter({
|
|
url: 'https://otlp.nr-data.net', // For US users, or https://otlp.eu01.nr-data.net for EU users
|
|
headers: { 'api-key': '<your-license-key>' },
|
|
compression: 'gzip' // Compression is recommended by NewRelic
|
|
})
|
|
}).start()
|
|
```
|
|
|
|
</Tabs.Tab>
|
|
|
|
</Tabs>
|
|
|
|
</Tabs.Tab>
|
|
|
|
<Tabs.Tab>
|
|
|
|
[DataDog Agent](https://docs.datadoghq.com/agent/) supports [OTLP over HTTP/gRPC](#otlp-over-http),
|
|
so you can use it by pointing the `@opentelemetry/exporter-trace-otlp-http` to the DataDog Agent
|
|
endpoint
|
|
|
|
You can also use the official DataDog Tracer Provider by using manual Hive Gateway deployment and
|
|
installing the dependency.
|
|
|
|
<Tabs items={['DataDog Tracer Provider', <div>Hive Gateway <code>openTelemetrySetup()</code> (recommended)</div>, <div>OpenTelemetry <code>NodeSDK</code></div>]}>
|
|
|
|
<Tabs.Tab>
|
|
|
|
The official DataDog's `TracerProvider` is the recommended approach, because it enable and sets up
|
|
the correlation with DataDog APM spans.
|
|
|
|
```sh npm2yarn
|
|
npm i dd-trace
|
|
```
|
|
|
|
```ts filename="telemetry.ts"
|
|
import ddTrace from 'dd-trace'
|
|
import { openTelemetrySetup } from '@graphql-hive/gateway/opentelemetry/setup'
|
|
|
|
const { TracerProvider } = ddTrace.init({
|
|
// Your configuration
|
|
})
|
|
|
|
openTelemetrySetup({
|
|
contextManager: null, // Don't register a context manager, DataDog Agent registers its own.
|
|
traces: {
|
|
tracerProvider: new TracerProvider()
|
|
}
|
|
})
|
|
```
|
|
|
|
</Tabs.Tab>
|
|
|
|
<Tabs.Tab>
|
|
|
|
It is possible to not use DataDog Agent if you want to only use DataDog as a tracing backend.
|
|
|
|
DataDog is compatible with standard OTLP over HTTP export format.
|
|
|
|
```sh npm2yarn
|
|
npm i @opentelemetry/exporter-trace-otlp-http
|
|
```
|
|
|
|
```ts filename="telemetry.ts"
|
|
import { openTelemetrySetup } from '@graphql-hive/gateway/opentelemetry/setup'
|
|
import { AsyncLocalStorageContextManager } from '@opentelemetry/context-async-hooks'
|
|
import { OTLPTraceExporter } from '@opentelemetry/exporter-trace-otlp-http'
|
|
|
|
openTelemetrySetup({
|
|
contextManager: new AsyncLocalStorageContextManager(),
|
|
traces: {
|
|
exporter: new OTLPTraceExporter({
|
|
url: 'http://<datadog-agent-host>:4318'
|
|
})
|
|
}
|
|
})
|
|
```
|
|
|
|
</Tabs.Tab>
|
|
|
|
<Tabs.Tab>
|
|
|
|
It is possible to not use DataDog Agent if you want to only use DataDog as a tracing backend.
|
|
|
|
DataDog is compatible with standard OTLP over HTTP export format.
|
|
|
|
```ts filename="telemetry.ts"
|
|
import { OTLPTraceExporter } from '@opentelemetry/exporter-trace-otlp-http'
|
|
import { NodeSDK } from '@opentelemetry/sdk-node'
|
|
|
|
new NodeSDK({
|
|
traceExporter: new OTLPTraceExporter({
|
|
url: 'http://<datadog-agent-host>:4318'
|
|
})
|
|
}).start()
|
|
```
|
|
|
|
</Tabs.Tab>
|
|
|
|
</Tabs>
|
|
|
|
</Tabs.Tab>
|
|
|
|
<Tabs.Tab>
|
|
|
|
[Zipkin](https://zipkin.io/) is using a custom protocol to send the spans, so you can use the Zipkin
|
|
exporter to send the spans to a Zipkin backend.
|
|
|
|
```sh npm2yarn
|
|
npm i @opentelemetry/exporter-zipkin
|
|
```
|
|
|
|
<Tabs items={[<div>Hive Gateway <code>openTelemetrySetup()</code> (recommended)</div>, <div>OpenTelemetry <code>NodeSDK</code></div>]}>
|
|
|
|
<Tabs.Tab>
|
|
|
|
```ts filename="telemetry.ts"
|
|
import { openTelemetrySetup } from '@graphql-hive/gateway/opentelemetry/setup'
|
|
import { AsyncLocalStorageContextManager } from '@opentelemetry/context-async-hooks'
|
|
import { ZipkinExporter } from '@opentelemetry/exporter-zipkin'
|
|
|
|
openTelemetrySetup({
|
|
contextManager: new AsyncLocalStorageContextManager(),
|
|
traces: {
|
|
exporter: new ZipkinExporter({
|
|
url: '<your-zipkin-endpoint>'
|
|
})
|
|
}
|
|
})
|
|
```
|
|
|
|
</Tabs.Tab>
|
|
|
|
<Tabs.Tab>
|
|
|
|
```ts filename="telemetry.ts"
|
|
import { ZipkinExporter } from '@opentelemetry/exporter-zipkin'
|
|
import { NodeSDK } from '@opentelemetry/sdk-node'
|
|
|
|
new NodeSDK({
|
|
traceExporter: new ZipkinExporter({
|
|
url: '<your-zipkin-endpoint>'
|
|
})
|
|
}).start()
|
|
```
|
|
|
|
</Tabs.Tab>
|
|
|
|
</Tabs>
|
|
|
|
</Tabs.Tab>
|
|
|
|
</Tabs>
|
|
|
|
#### Context Propagation
|
|
|
|
By default, Hive Gateway will
|
|
[propagate the trace context](https://opentelemetry.io/docs/concepts/context-propagation/) between
|
|
the incoming HTTP request and the outgoing HTTP requests using standard Baggage and Trace Context
|
|
propagators.
|
|
|
|
You can configure the list of propagators that will be used. All official propagators are bundled
|
|
with Hive Gateway CLI. To use other non-official propagators, please switch to manual deployment.
|
|
|
|
You will also have to pick a Context Manager. It will be responsible to keep track of the current
|
|
OpenTelemetry Context at any point of program. We recommend using the official
|
|
`AsyncLocalStorageContextManager` from `@opentelemetry/context-async-hooks` when `AsyncLocalStorage`
|
|
API is available. In other cases, you can either try `@opentelemetry/context-zone`, or pass `null`
|
|
to not use any context manager.
|
|
|
|
If no Context Manager compatible with async is registered, automatic parenting of custom spans will
|
|
not work. You will have to retrieve the current OpenTelemetry context from the GraphQL context, or
|
|
from the `getActiveContext` method of the plugin instance.
|
|
|
|
<Tabs items={[<div>Hive Gateway <code>openTelemetrySetup()</code> (recommended)</div>, <div>OpenTelemetry <code>NodeSDK</code></div>]}>
|
|
|
|
<Tabs.Tab>
|
|
|
|
```sh npm2yarn
|
|
npm i @opentelemetry/context-async-hooks @opentelemetry/exporter-trace-otlp-grpc @opentelemetry/propagator-b3
|
|
```
|
|
|
|
```ts filename="telemetry.ts"
|
|
import { openTelemetrySetup } from '@graphql-hive/gateway/opentelemetry/setup'
|
|
import { AsyncLocalStorageContextManager } from '@opentelemetry/context-async-hooks'
|
|
import { OTLPTraceExporter } from '@opentelemetry/exporter-trace-otlp-grpc'
|
|
import { B3Propagator } from '@opentelemetry/propagator-b3'
|
|
|
|
openTelemetrySetup({
|
|
contextManager: new AsyncLocalStorageContextManager(),
|
|
traces: {
|
|
exporter: new OTLPTraceExporter({ url: 'http://<otlp-endpoint>:4317' })
|
|
},
|
|
propagators: [new B3Propagator()]
|
|
})
|
|
```
|
|
|
|
</Tabs.Tab>
|
|
|
|
<Tabs.Tab>
|
|
|
|
```sh npm2yarn
|
|
npm i @opentelemetry/sdk-node @opentelemetry/exporter-trace-otlp-grpc @opentelemetry/propagator-b3
|
|
```
|
|
|
|
```ts filename="telemetry.ts"
|
|
import { OTLPTraceExporter } from '@opentelemetry/exporter-trace-otlp-grpc'
|
|
import { B3Propagator } from '@opentelemetry/propagator-b3'
|
|
import { NodeSDK } from '@opentelemetry/sdk-node'
|
|
|
|
new NodeSDK({
|
|
traceExporter: new OTLPTraceExporter({ url: 'http://<otlp-endpoint>:4317' }),
|
|
textMapPropagator: new B3Propagator()
|
|
}).start()
|
|
```
|
|
|
|
</Tabs.Tab>
|
|
|
|
</Tabs>
|
|
|
|
#### Span Batching
|
|
|
|
By default, if you provide only a Trace Exporter, it will be wrapped into a `BatchSpanProcessor` to
|
|
batch spans together and reduce the number of request to you backend.
|
|
|
|
This is an important feature for a real world production environment, and you can configure its
|
|
behavior to exactly suites your infrastructure limits.
|
|
|
|
By default, the batch processor will send the spans every 5 seconds or when the buffer is full.
|
|
|
|
<Tabs items={[<div>Hive Gateway <code>openTelemetrySetup()</code> (recommended)</div>, <div>OpenTelemetry <code>NodeSDK</code></div>]}>
|
|
|
|
<Tabs.Tab>
|
|
|
|
The following configuration are allowed:
|
|
|
|
- `true` (default): enables batching and use
|
|
[`BatchSpanProcessor`](https://opentelemetry.io/docs/specs/otel/trace/sdk/#batching-processor)
|
|
default config.
|
|
- `object`: enables batching and use
|
|
[`BatchSpanProcessor`](https://opentelemetry.io/docs/specs/otel/trace/sdk/#batching-processor)
|
|
with the provided configuration.
|
|
- `false` - disables batching and use
|
|
[`SimpleSpanProcessor`](https://opentelemetry.io/docs/specs/otel/trace/sdk/#simple-processor)
|
|
|
|
```ts filename="telemetry.ts"
|
|
import { openTelemetrySetup } from '@graphql-hive/gateway/opentelemetry/setup'
|
|
|
|
openTelemetrySetup({
|
|
traces: {
|
|
exporter: ...,
|
|
batching: {
|
|
exportTimeoutMillis: 30_000, // Default to 30_000ms
|
|
maxExportBatchSize: 512, // Default to 512 spans
|
|
maxQueueSize: 2048, // Default to 2048 spans
|
|
scheduledDelayMillis: 5_000, // Default to 5_000ms
|
|
}
|
|
},
|
|
})
|
|
```
|
|
|
|
</Tabs.Tab>
|
|
|
|
<Tabs.Tab>
|
|
|
|
```ts filename="telemetry.ts"
|
|
import { NodeSDK, tracing } from '@opentelemetry/sdk-node'
|
|
|
|
const exporter = ...
|
|
|
|
new NodeSDK({
|
|
spanProcessors: [
|
|
new tracing.BatchSpanProcessor(
|
|
exporter,
|
|
{
|
|
exportTimeoutMillis: 30_000, // Default to 30_000ms
|
|
maxExportBatchSize: 512, // Default to 512 spans
|
|
maxQueueSize: 2048, // Default to 2048 spans
|
|
scheduledDelayMillis: 5_000, // Default to 5_000ms
|
|
},
|
|
),
|
|
],
|
|
}).start()
|
|
```
|
|
|
|
</Tabs.Tab>
|
|
|
|
</Tabs>
|
|
|
|
You can learn more about the batching options in the
|
|
[Picking the right span processor](https://opentelemetry.io/docs/languages/js/instrumentation/#picking-the-right-span-processor)
|
|
page.
|
|
|
|
#### Sampling
|
|
|
|
When your gateway have a lot of traffic, tracing every requests can become a very expensive
|
|
approach.
|
|
|
|
A mitigation for this problem is to trace only some requests, using a strategy to choose which
|
|
request to trace or not.
|
|
|
|
The most common strategy is to combine both a parent first (a span is picked if parent is picked)
|
|
and a ratio based on trace id (each trace, one by request, have a chance to be picked, with a given
|
|
rate).
|
|
|
|
By default, all requests are traced. You can either provide you own Sampler, or provide a sampling
|
|
rate which will be used to setup a Parent + TraceID Ratio strategy.
|
|
|
|
<Tabs items={[<div>Hive Gateway <code>openTelemetrySetup()</code> (recommended)</div>, <div>OpenTelemetry <code>NodeSDK</code></div>]}>
|
|
|
|
<Tabs.Tab>
|
|
|
|
```ts filename="telemetry.ts"
|
|
import { openTelemetrySetup } from '@graphql-hive/gateway/opentelemetry/setup'
|
|
import { JaegerRemoteSampler } from '@opentelemetry/sampler-jaeger-remote'
|
|
import { AlwaysOnSampler } from '@opentelemetry/sdk-trace-base'
|
|
|
|
openTelemetrySetup({
|
|
// Use Parent + TraceID Ratio strategy
|
|
samplingRate: 0.1,
|
|
|
|
// Or use a custom Sampler
|
|
sampler: new JaegerRemoteSampler({
|
|
endpoint: 'http://your-jaeger-agent:14268/api/sampling',
|
|
serviceName: 'your-service-name',
|
|
initialSampler: new AlwaysOnSampler(),
|
|
poolingInterval: 60000 // 60 seconds
|
|
})
|
|
})
|
|
```
|
|
|
|
</Tabs.Tab>
|
|
|
|
<Tabs.Tab>
|
|
|
|
```ts filename="telemetry.ts"
|
|
import { JaegerRemoteSampler } from '@opentelemetry/sampler-jaeger-remote'
|
|
import { NodeSDK, tracing } from '@opentelemetry/sdk-node'
|
|
|
|
new NodeSDK({
|
|
// Use Parent + TraceID Ratio strategy
|
|
sampler: new ParentBasedSampler({
|
|
root: new TraceIdRatioBasedSampler(0.1)
|
|
}),
|
|
|
|
// Or use a custom Sampler
|
|
sampler: new JaegerRemoteSampler({
|
|
endpoint: 'http://your-jaeger-agent:14268/api/sampling',
|
|
serviceName: 'your-service-name',
|
|
initialSampler: new tracing.AlwaysOnSampler(),
|
|
poolingInterval: 60000 // 60 seconds
|
|
})
|
|
}).start()
|
|
```
|
|
|
|
</Tabs.Tab>
|
|
|
|
</Tabs>
|
|
|
|
#### Limits
|
|
|
|
To ensure that you don't overwhelm your tracing ingestion infrastructure, you can set limits for
|
|
both cardinality and amount of data the OpenTelemetry SDK will be allowed to generate.
|
|
|
|
<Tabs items={[<div>Hive Gateway <code>openTelemetrySetup()</code> (recommended)</div>, <div>OpenTelemetry <code>NodeSDK</code></div>]}>
|
|
|
|
<Tabs.Tab>
|
|
|
|
```ts filename="telemetry.ts"
|
|
import { openTelemetrySetup } from '@graphql-hive/gateway/opentelemetry/setup'
|
|
|
|
openTelemetrySetup({
|
|
generalLimits: {
|
|
//...
|
|
},
|
|
traces: {
|
|
spanLimits: {
|
|
//...
|
|
}
|
|
}
|
|
})
|
|
```
|
|
|
|
</Tabs.Tab>
|
|
|
|
<Tabs.Tab>
|
|
|
|
```ts filename="telemetry.ts"
|
|
import { NodeSDK } from '@opentelemetry/sdk-node'
|
|
|
|
new NodeSDK({
|
|
generalLimits: {
|
|
//...
|
|
},
|
|
spanLimits: {
|
|
//...
|
|
}
|
|
}).start()
|
|
```
|
|
|
|
</Tabs.Tab>
|
|
|
|
</Tabs>
|
|
|
|
### Configuration
|
|
|
|
Once you have an OpenTelemetry setup file, you must import it from you `gateway.config.ts` file. It
|
|
must be the very first import so that any other package relying on OpenTelemetry have access to the
|
|
correct configuration.
|
|
|
|
You can then enable OpenTelemetry Tracing support in the Gateway configuration.
|
|
|
|
<Tabs items={['CLI', 'Programmatic Usage']}>
|
|
|
|
<Tabs.Tab>
|
|
|
|
with CLI, you can either enable OpenTelemetry tracing by using `--opentelemetry` option or by using
|
|
the configuration file.
|
|
|
|
<Tabs items={["CLI", "Configuration file"]}>
|
|
|
|
<Tabs.Tab>
|
|
|
|
```bash
|
|
hive-gateway supergraph --opentelemetry
|
|
```
|
|
|
|
</Tabs.Tab>
|
|
|
|
<Tabs.Tab>
|
|
|
|
```ts filename="gateway.config.ts"
|
|
import { defineConfig } from '@graphql-hive/gateway'
|
|
import { openTelemetrySetup } from '@graphql-hive/gateway/opentelemetry/setup'
|
|
|
|
openTelemetrySetup({
|
|
//...
|
|
})
|
|
|
|
export const gatewayConfig = defineConfig({
|
|
openTelemetry: {
|
|
traces: true
|
|
}
|
|
})
|
|
```
|
|
|
|
</Tabs.Tab>
|
|
|
|
</Tabs>
|
|
|
|
</Tabs.Tab>
|
|
|
|
<Tabs.Tab>
|
|
|
|
```sh npm2yarn
|
|
npm i @graphql-hive/plugin-opentelemetry
|
|
```
|
|
|
|
```ts filename="index.ts"
|
|
import { createGatewayRuntime } from '@graphql-hive/gateway-runtime'
|
|
import { useOpenTelemetry } from '@graphql-hive/plugin-opentelemetry'
|
|
import { openTelemetrySetup } from '@graphql-hive/plugin-opentelemetry/setup'
|
|
|
|
openTelemetrySetup({
|
|
//...
|
|
})
|
|
|
|
export const gateway = createGatewayRuntime({
|
|
plugins: ctx => [
|
|
useOpenTelemetry({
|
|
...ctx,
|
|
traces: true
|
|
})
|
|
]
|
|
})
|
|
```
|
|
|
|
</Tabs.Tab>
|
|
|
|
</Tabs>
|
|
|
|
#### OpenTelemetry Context
|
|
|
|
To correlate all observability events (like tracing, metrics, logs...), OpenTelemetry have a global
|
|
and standard Context API.
|
|
|
|
This context also allows to keep the link between related spans (for parenting or linking of spans).
|
|
|
|
You can configure the behavior of the plugin with this context.
|
|
|
|
```ts filename="gateway.config.ts"
|
|
const openTelemetryConfig = {
|
|
useContextManager: true, // If false, the parenting of spans will not rely on OTEL Context
|
|
inheritContext: true, // If false, the root span will not be based on OTEL Context, it will always be a root span
|
|
propagateContext: true // If false, the context will not be propagated to subgraphs
|
|
})
|
|
```
|
|
|
|
#### OpenTelemetry Diagnostics
|
|
|
|
If you encounter an issue with you OpenTelemetry setup, you can enable the Diagnostics API. This
|
|
will enable logging of OpenTelemetry SDK based on `OTEL_LOG_LEVEL` env variable.
|
|
|
|
By default, Hive Gateway configure the Diagnostics API to output logs using Hive Gateway's logger.
|
|
You can disable this using `configureDiagLogger` option.
|
|
|
|
```ts filename="gateway.config.ts"
|
|
const openTelemetryConfig = {
|
|
// Use the default DiagLogger, which outputs logs directly to stdout
|
|
configureDiagLogger: false
|
|
}
|
|
```
|
|
|
|
#### Graceful shutdown
|
|
|
|
Since spans are batched by default, it is possible to miss some traces if the batching processor is
|
|
not properly flushed when the process exits.
|
|
|
|
To avoid this kind of data loss, Hive Gateway is calling `forceFlush` method on the registered
|
|
Tracer Provider by default. You can customize which method to call or entirely disable this behavior
|
|
by using the `flushOnDispose` option.
|
|
|
|
```ts filename="gateway.config.ts"
|
|
const openTelemetryConfig = {
|
|
// Disable the auto-flush on shutdown
|
|
flushOnDispose: false,
|
|
// or call a custom method
|
|
flushOnDispose: 'flush'
|
|
}
|
|
```
|
|
|
|
#### Tracer
|
|
|
|
By default, Hive Gateway will create a tracer named `gateway`. You can provide your own tracer if
|
|
needed.
|
|
|
|
```ts filename="gateway.config.ts"
|
|
const openTelemetryConfig = {
|
|
traces: {
|
|
tracer: trace.getTracer('my-custom-tracer')
|
|
}
|
|
}
|
|
```
|
|
|
|
### Reported Spans
|
|
|
|
The plugin exports the following OpenTelemetry Spans:
|
|
|
|
#### Background Spans
|
|
|
|
<details>
|
|
|
|
<summary>Gateway Initialization</summary>
|
|
|
|
By default, the plugin will create a span from the start of the gateway process to the first schema
|
|
load.
|
|
|
|
All spans happening during this time will be parented under this initialization span, including the
|
|
schema loading span.
|
|
|
|
You may disable this by setting `traces.spans.initialization` to `false`:
|
|
|
|
```ts
|
|
const openTelemetryConfig = {
|
|
traces: {
|
|
spans: {
|
|
initialization: false
|
|
}
|
|
}
|
|
}
|
|
```
|
|
|
|
</details>
|
|
|
|
<details>
|
|
|
|
<summary>Schema Loading</summary>
|
|
|
|
By default, the plugin will create a span covering each loading of a schema. It can be useful when
|
|
polling or file watch is enabled to identify when the schema changes.
|
|
|
|
Schema loading in Hive Gateway can be lazy, which means it can be triggered as part of the handling
|
|
of a request. If it happens, the schema loading span will be added as a link to the current span.
|
|
|
|
You may disable this by setting `traces.spans.schema` to `false`:
|
|
|
|
```ts
|
|
const openTelemetryConfig = {
|
|
traces: {
|
|
spans: {
|
|
schema: false
|
|
}
|
|
}
|
|
}
|
|
```
|
|
|
|
</details>
|
|
|
|
#### Request Spans
|
|
|
|
<details>
|
|
|
|
<summary>HTTP Request</summary>
|
|
|
|
<Callout>
|
|
This span is created for each incoming HTTP request, and acts as a root span for the entire
|
|
request. Disabling this span will also disable the other hooks and spans.
|
|
</Callout>
|
|
|
|
By default, the plugin will create a root span for the HTTP layer as a span (`<METHOD> /path`, eg.
|
|
`POST /graphql`) with the following attributes:
|
|
|
|
- `http.method`: The HTTP method
|
|
- `http.url`: The HTTP URL
|
|
- `http.route`: The HTTP status code
|
|
- `http.scheme`: The HTTP scheme
|
|
- `http.host`: The HTTP host
|
|
- `net.host.name`: The hostname
|
|
- `http.user_agent`: The HTTP user agent (based on the `User-Agent` header)
|
|
- `http.client_ip`: The HTTP connecting IP (based on the `X-Forwarded-For` header)
|
|
|
|
And the following attributes for the HTTP response:
|
|
|
|
- `http.status_code`: The HTTP status code
|
|
|
|
<Callout>
|
|
An error in the this phase will be reported as an [error
|
|
span](https://opentelemetry.io/docs/specs/semconv/exceptions/exceptions-spans/) with the HTTP
|
|
status text and as an OpenTelemetry
|
|
[`Exception`](https://opentelemetry.io/docs/specs/otel/trace/exceptions/).
|
|
</Callout>
|
|
|
|
You may disable this by setting `traces.spans.http` to `false`:
|
|
|
|
```ts
|
|
const openTelemetryConfig = {
|
|
traces: {
|
|
spans: {
|
|
http: false
|
|
}
|
|
}
|
|
}
|
|
```
|
|
|
|
Or, you may filter the spans by setting the `traces.spans.http` configuration to a function:
|
|
|
|
```ts filename="gateway.config.ts"
|
|
const openTelemetryConfig = {
|
|
traces: {
|
|
spans: {
|
|
http: ({ request }) => {
|
|
// Filter the spans based on the request
|
|
return true
|
|
}
|
|
}
|
|
}
|
|
}
|
|
```
|
|
|
|
</details>
|
|
|
|
<details>
|
|
|
|
<summary>GraphQL Operation</summary>
|
|
|
|
<Callout>
|
|
This span is created for each GraphQL operation found in incoming HTTP requests, and acts as a
|
|
parent span for the entire graphql operation. Disabling this span will also disable the other
|
|
hooks and spans related to the execution of operation.
|
|
</Callout>
|
|
|
|
By default, the plugin will create a span for the GraphQL layer as a span
|
|
(`graphql.operation <operation name>` or `graphql.operation` for unexecutable operations) with the
|
|
following attributes:
|
|
|
|
- `graphql.operation.type`: The type of operation (`query`, `mutation` or `subscription`).
|
|
- `graphql.operation.name`: The name of the operation to execute, `Anonymous` for operations without
|
|
name.
|
|
- `graphql.document`: The operation document as a GraphQL string
|
|
|
|
<Callout>
|
|
An error in the parse phase will be reported as an [error
|
|
span](https://opentelemetry.io/docs/specs/semconv/exceptions/exceptions-spans/), including the
|
|
error message and as an OpenTelemetry
|
|
[`Exception`](https://opentelemetry.io/docs/specs/otel/trace/exceptions/).
|
|
</Callout>
|
|
|
|
You may disable this by setting `traces.spans.graphql` to `false`:
|
|
|
|
```ts
|
|
const openTelemetryConfig = {
|
|
traces: {
|
|
traces: {
|
|
spans: {
|
|
graphql: false
|
|
}
|
|
}
|
|
}
|
|
}
|
|
```
|
|
|
|
Or, you may filter the spans by setting the `traces.spans.graphql` configuration to a function which
|
|
takes the GraphQL context as parameter:
|
|
|
|
```ts filename="gateway.config.ts"
|
|
const openTelemetryConfig = {
|
|
traces: {
|
|
spans: {
|
|
graphql: ({ context }) => {
|
|
// Filter the span based on the GraphQL context
|
|
return true
|
|
}
|
|
}
|
|
}
|
|
}
|
|
```
|
|
|
|
</details>
|
|
|
|
<details>
|
|
|
|
<summary>GraphQL Parse</summary>
|
|
|
|
By default, the plugin will report the validation phase as a span (`graphql.validate`) with the
|
|
following attributes:
|
|
|
|
- `graphql.document`: The GraphQL query string
|
|
- `graphql.operation.name`: The operation name
|
|
|
|
If a parsing error is reported, the following attribute will also be present:
|
|
|
|
- `graphql.error.count`: `1` if a parse error occurred
|
|
|
|
<Callout>
|
|
An error in the parse phase will be reported as an [error
|
|
span](https://opentelemetry.io/docs/specs/semconv/exceptions/exceptions-spans/), including the
|
|
error message and as an OpenTelemetry
|
|
[`Exception`](https://opentelemetry.io/docs/specs/otel/trace/exceptions/).
|
|
</Callout>
|
|
|
|
You may disable this by setting `traces.spans.graphqlParse` to `false`:
|
|
|
|
```ts filename="gateway.config.ts"
|
|
const openTelemetryConfig = {
|
|
traces: {
|
|
spans: {
|
|
graphqlParse: false
|
|
}
|
|
}
|
|
}
|
|
```
|
|
|
|
Or, you may filter the spans by setting the `traces.spans.graphqlParse` configuration to a function:
|
|
|
|
```ts filename="gateway.config.ts"
|
|
const openTelemetryConfig = {
|
|
traces: {
|
|
spans: {
|
|
graphqlParse: ({ context }) => {
|
|
// Filter the spans based on the GraphQL context
|
|
return true
|
|
}
|
|
}
|
|
}
|
|
}
|
|
```
|
|
|
|
</details>
|
|
|
|
<details>
|
|
|
|
<summary>GraphQL Validate</summary>
|
|
|
|
By default, the plugin will report the validation phase as a span (`graphql.validate`) with the
|
|
following attributes:
|
|
|
|
- `graphql.document`: The GraphQL query string
|
|
- `graphql.operation.name`: The operation name
|
|
|
|
If a validation error is reported, the following attribute will also be present:
|
|
|
|
- `graphql.error.count`: The number of validation errors
|
|
|
|
<Callout>
|
|
An error in the validate phase will be reported as an [error
|
|
span](https://opentelemetry.io/docs/specs/semconv/exceptions/exceptions-spans/), including the
|
|
error message and as an OpenTelemetry
|
|
[`Exception`](https://opentelemetry.io/docs/specs/otel/trace/exceptions/).
|
|
</Callout>
|
|
|
|
You may disable this by setting `traces.spans.graphqlValidate` to `false`:
|
|
|
|
```ts filename="gateway.config.ts"
|
|
const openTelemetryConfig = {
|
|
traces: {
|
|
spans: {
|
|
graphqlValidate: false
|
|
}
|
|
}
|
|
}
|
|
```
|
|
|
|
Or, you may filter the spans by setting the `traces.spans.graphqlValidate` configuration to a
|
|
function:
|
|
|
|
```ts filename="gateway.config.ts"
|
|
const openTelemetryConfig = {
|
|
traces: {
|
|
spans: {
|
|
graphqlValidate: ({ context }) => {
|
|
// Filter the spans based on the GraphQL context
|
|
return true
|
|
}
|
|
}
|
|
}
|
|
}
|
|
```
|
|
|
|
</details>
|
|
|
|
<details>
|
|
|
|
<summary>Graphql Context Building</summary>
|
|
|
|
By default, the plugin will report the validation phase as a span (`graphql.context`). This span
|
|
doesn't have any attribute.
|
|
|
|
<Callout>
|
|
An error in the context building phase will be reported as an [error
|
|
span](https://opentelemetry.io/docs/specs/semconv/exceptions/exceptions-spans/), including the
|
|
error message and as an OpenTelemetry
|
|
[`Exception`](https://opentelemetry.io/docs/specs/otel/trace/exceptions/).
|
|
</Callout>
|
|
|
|
You may disable this by setting `traces.spans.graphqlContextBuilding` to `false`:
|
|
|
|
```ts filename="gateway.config.ts"
|
|
const openTelemetryConfig = {
|
|
traces: {
|
|
spans: {
|
|
graphqlContextBuilding: false
|
|
}
|
|
}
|
|
}
|
|
```
|
|
|
|
Or, you may filter the spans by setting the `traces.spans.graphqlContextBuilding` configuration to a
|
|
function:
|
|
|
|
```ts filename="gateway.config.ts"
|
|
const openTelemetryConfig = {
|
|
traces: {
|
|
spans: {
|
|
graphqlContextBuilding: ({ context }) => {
|
|
// Filter the spans based on the GraphQL context
|
|
return true
|
|
}
|
|
}
|
|
}
|
|
}
|
|
```
|
|
|
|
</details>
|
|
|
|
<details>
|
|
|
|
<summary>GraphQL Execute</summary>
|
|
|
|
By default, the plugin will report the execution phase as a span (`graphql.execute`) with the
|
|
following attributes:
|
|
|
|
- `graphql.document`: The GraphQL query string
|
|
- `graphql.operation.name`: The operation name (`Anonymous` for operations without name)
|
|
- `graphql.operation.type`: The operation type (`query`/`mutation`/`subscription`)
|
|
|
|
If an execution error is reported, the following attribute will also be present:
|
|
|
|
- `graphql.error.count`: The number of errors in the execution result
|
|
|
|
<Callout>
|
|
An error in the execute phase will be reported as an [error
|
|
span](https://opentelemetry.io/docs/specs/semconv/exceptions/exceptions-spans/), including the
|
|
error message and as an OpenTelemetry
|
|
[`Exception`](https://opentelemetry.io/docs/specs/otel/trace/exceptions/).
|
|
</Callout>
|
|
|
|
You may disable this by setting `traces.spans.graphqlExecute` to `false`:
|
|
|
|
```ts filename="gateway.config.ts"
|
|
const openTelemetryConfig = {
|
|
traces: {
|
|
spans: {
|
|
graphqlExecute: false
|
|
}
|
|
}
|
|
}
|
|
```
|
|
|
|
Or, you may filter the spans by setting the `traces.spans.graphqlExecute` configuration to a
|
|
function:
|
|
|
|
```ts filename="gateway.config.ts"
|
|
const openTelemetryConfig = {
|
|
traces: {
|
|
spans: {
|
|
graphqlExecute: ({ context }) => {
|
|
// Filter the spans based on the GraphQL context
|
|
return true
|
|
}
|
|
}
|
|
}
|
|
}
|
|
```
|
|
|
|
</details>
|
|
|
|
<details>
|
|
|
|
<summary>Subgraph Execute</summary>
|
|
|
|
By default, the plugin will report the subgraph execution phase as a client span
|
|
(`subgraph.execute`) with the following attributes:
|
|
|
|
- `graphql.document`: The GraphQL query string executed to the upstream
|
|
- `graphql.operation.name`: The operation name
|
|
- `graphql.operation.type`: The operation type (`query`/`mutation`/`subscription`)
|
|
- `gateway.upstream.subgraph.name`: The name of the upstream subgraph
|
|
|
|
You may disable this by setting `traces.spans.subgraphExecute` to `false`:
|
|
|
|
```ts filename="gateway.config.ts"
|
|
const openTelemetryConfig = {
|
|
traces: {
|
|
spans: {
|
|
subgraphExecute: false
|
|
}
|
|
}
|
|
}
|
|
```
|
|
|
|
Or, you may filter the spans by setting the `traces.spans.subgraphExecute` configuration to a
|
|
function:
|
|
|
|
```ts filename="gateway.config.ts"
|
|
const openTelemetryConfig = {
|
|
traces: {
|
|
spans: {
|
|
subgraphExecute: ({ executionRequest, subgraphName }) => {
|
|
// Filter the spans based on the target SubGraph name and the Execution Request
|
|
return true
|
|
}
|
|
}
|
|
}
|
|
}
|
|
```
|
|
|
|
</details>
|
|
|
|
<details>
|
|
|
|
<summary>Upstream Fetch</summary>
|
|
|
|
By default, the plugin will report the upstream fetch phase as a span (`http.fetch`) with the
|
|
information about outgoing HTTP calls.
|
|
|
|
The following attributes are included in the span:
|
|
|
|
- `http.method`: The HTTP method
|
|
- `http.url`: The HTTP URL
|
|
- `http.route`: The HTTP status code
|
|
- `http.scheme`: The HTTP scheme
|
|
- `net.host.name`: The hostname
|
|
- `http.host`: The HTTP host
|
|
- `http.request.resend_count`: Number of retry attempt. Only present starting from the first retry.
|
|
|
|
And the following attributes for the HTTP response:
|
|
|
|
- `http.status_code`: The HTTP status code
|
|
|
|
<Callout>
|
|
An error in the fetch phase (including responses with a non-ok status code) will be reported as an
|
|
[error span](https://opentelemetry.io/docs/specs/semconv/exceptions/exceptions-spans/), including
|
|
the error message and as an OpenTelemetry
|
|
[`Exception`](https://opentelemetry.io/docs/specs/otel/trace/exceptions/).
|
|
</Callout>
|
|
|
|
You may disable this by setting `traces.spans.upstreamFetch` to `false`:
|
|
|
|
```ts filename="gateway.config.ts"
|
|
const openTelemetryConfig = {
|
|
traces: {
|
|
spans: {
|
|
upstreamFetch: false
|
|
}
|
|
}
|
|
}
|
|
```
|
|
|
|
Or, you may filter the spans by setting the `traces.spans.upstreamFetch` configuration to a
|
|
function:
|
|
|
|
```ts filename="gateway.config.ts"
|
|
const openTelemetryConfig = {
|
|
traces: {
|
|
spans: {
|
|
upstreamFetch: ({ executionRequest }) => {
|
|
// Filter the spans based on the Execution Request
|
|
return true
|
|
}
|
|
}
|
|
}
|
|
}
|
|
```
|
|
|
|
</details>
|
|
|
|
### Reported Events
|
|
|
|
The plugin exports the following OpenTelemetry Events.
|
|
|
|
Events are attached to the current span, meaning that they will be attached to your custom spans if
|
|
you use them. It also means that events can be orphans if you didn't properly setup an async
|
|
compatible Context Manager
|
|
|
|
<details>
|
|
|
|
<summary>Cache Read and Write</summary>
|
|
|
|
By default, the plugin will report any cache read or write as an event. The possible event names
|
|
are:
|
|
|
|
- `gateway.cache.miss`: A cache read happened, but the key didn't match any entity
|
|
- `gateway.cache.hit`: A cache read happened, and the key did match an entity
|
|
- `gateway.cache.write`: A new entity have been added to the cache store
|
|
|
|
All those events have the following attributes:
|
|
|
|
- `gateway.cache.key`: The key of the cache entry
|
|
- `gateway.cache.ttl`: The ttl of the cache entry
|
|
|
|
You may disable this by setting `traces.events.cache` to `false`:
|
|
|
|
```ts filename="gateway.config.ts"
|
|
const openTelemetryConfig = {
|
|
traces: {
|
|
events: {
|
|
cache: false
|
|
}
|
|
}
|
|
}
|
|
```
|
|
|
|
Or, you may filter the spans by setting the `traces.spans.upstreamFetch` configuration to a
|
|
function:
|
|
|
|
```ts filename="gateway.config.ts"
|
|
const openTelemetryConfig = {
|
|
traces: {
|
|
events: {
|
|
cache: ({ key, action }) => {
|
|
// Filter the event based on action ('read' or 'write') and the entity key
|
|
return true
|
|
}
|
|
}
|
|
}
|
|
}
|
|
```
|
|
|
|
</details>
|
|
|
|
<details>
|
|
|
|
<summary>Cache Error</summary>
|
|
|
|
By default, the plugin will report any cache error as an event (`gateway.cache.error`). This events
|
|
have the following attributes:
|
|
|
|
- `gateway.cache.key`: The key of the cache entry
|
|
- `gateway.cache.ttl`: The ttl of the cache entry
|
|
- `gateway.cache.action`: The type of action (`read` or `write`)
|
|
- `exception.type`: The type of error (the `code` if it exists, the message otherwise)
|
|
- `exception.message`: The message of the error
|
|
- `exception.stacktrace`: The error stacktrace as a string
|
|
|
|
You may disable this by setting `traces.events.cache` to `false`:
|
|
|
|
```ts filename="gateway.config.ts"
|
|
const openTelemetryConfig = {
|
|
traces: {
|
|
events: {
|
|
cache: false
|
|
}
|
|
}
|
|
}
|
|
```
|
|
|
|
Or, you may filter the spans by setting the `traces.spans.upstreamFetch` configuration to a
|
|
function:
|
|
|
|
```ts filename="gateway.config.ts"
|
|
const openTelemetryConfig = {
|
|
traces: {
|
|
events: {
|
|
cache: ({ key, action }) => {
|
|
// Filter the event based on action ('read' or 'write') and the entity key
|
|
return true
|
|
}
|
|
}
|
|
}
|
|
}
|
|
```
|
|
|
|
</details>
|
|
|
|
### Custom spans
|
|
|
|
Hive Gateway relies on official OpenTelemetry API, which means it is compatible with
|
|
`@opentelemetry/api`.
|
|
|
|
You can use any tool relying on it too, or directly use it to create your own custom spans.
|
|
|
|
To parent spans correctly, an async compatible Context Manager is highly recommended, but we also
|
|
provide an alternative if your runtime doesn't implement `AsyncLocalStorage` or you want to avoid
|
|
the related performance cost.
|
|
|
|
<Tabs items={["With Context Manager", "Without Context Manager"]}>
|
|
|
|
<Tabs.Tab>
|
|
|
|
If you are using an async compatible context manager, you can simply use the standard
|
|
`@opentelemetry/api` methods, as shown in
|
|
[OpenTelemetry documentation](https://opentelemetry.io/docs/languages/js/instrumentation/#create-spans).
|
|
|
|
<Tabs items={['CLI', 'Programmatic Usage']}>
|
|
|
|
<Tabs.Tab>
|
|
|
|
The Gateway's tracer is available can be accessed through the Hive Gateway OpenTelemetry API
|
|
(`@graphql-hive/gateway/opentelemetry/api`).
|
|
|
|
Note that the `tracer` will be defined only once the OpenTelemetry plugin has been instantiated,
|
|
which means it will not be defined at import time or if `openTelemetry` option is `false`.
|
|
|
|
You can also create your own tracer instead of reusing the Gateway one.
|
|
|
|
```ts filename="gateway.config.ts"
|
|
import { defineConfig } from '@graphql-hive/gateway'
|
|
import { openTelemetrySetup } from '@graphql-hive/gateway/opentelemetry/setup'
|
|
import { hive } from '@graphql-hive/gateway/opentelemetry/api'
|
|
import { AsyncLocalStorageContextManager } from '@opentelemetry/context-async-hooks'
|
|
import { useGenericAuth } from '@envelop/generic-auth'
|
|
|
|
openTelemetrySetup({
|
|
contextManager: new AsyncLocalStorageContextManager(),
|
|
traces: { console: true },
|
|
})
|
|
|
|
export const gatewayConfig = defineConfig({
|
|
openTelemetry: {
|
|
traces: true,
|
|
},
|
|
genericAuth: {
|
|
resolveUserFn: (context) => {
|
|
// `startActiveSpan` will rely on the current context to parent the new span correctly
|
|
// You can also use your own tracer instead of Hive Gateway's one.
|
|
return hive.tracer!.startActiveSpan('users.fetch', (span) => {
|
|
const user = await fetchUser(extractUserIdFromContext(context))
|
|
span.end();
|
|
return user
|
|
})
|
|
}
|
|
},
|
|
})
|
|
```
|
|
|
|
</Tabs.Tab>
|
|
|
|
<Tabs.Tab>
|
|
|
|
The Gateway's tracer is available can be accessed through the Hive Gateway OpenTelemetry API
|
|
(`@graphql-hive/gateway/opentelemetry/api`).
|
|
|
|
Note that the `tracer` will be defined only once the OpenTelemetry plugin has been instantiated,
|
|
which means it will not be defined at import time or if no OpenTelemetry plugin is used.
|
|
|
|
You can also create your own tracer instead of reusing the Gateway one.
|
|
|
|
```ts filename="index.ts"
|
|
import { createGatewayRuntime } from '@graphql-hive/gateway-runtime'
|
|
import { useOpenTelemetry } from '@graphql-hive/plugin-opentelemetry'
|
|
import { hive } from '@graphql-hive/plugin-opentelemetry/api'
|
|
import { openTelemetrySetup } from '@graphql-hive/plugin-opentelemetry/setup'
|
|
import { AsyncLocalStorageContextManager } from '@opentelemetry/context-async-hooks'
|
|
import { useGenericAuth } from '@envelop/generic-auth'
|
|
|
|
openTelemetrySetup({
|
|
contextManager: new AsyncLocalStorageContextManager(),
|
|
traces: { console: true },
|
|
})
|
|
|
|
export const gateway = createGatewayRuntime({
|
|
plugins: ctx => {
|
|
return [
|
|
useOpenTelemetry({
|
|
...ctx,
|
|
traces: true
|
|
}),
|
|
useGenericAuth({
|
|
resolveUserFn: (context) => {
|
|
// `startActiveSpan` will rely on the current context to parent the new span correctly
|
|
// You can also use your own tracer instead of Hive Gateway's one.
|
|
return hive.tracer!.startActiveSpan('users.fetch', (span) => {
|
|
const user = await fetchUser(extractUserIdFromContext(context))
|
|
span.end();
|
|
return user
|
|
})
|
|
},
|
|
}),
|
|
],
|
|
}
|
|
})
|
|
```
|
|
|
|
</Tabs.Tab>
|
|
|
|
</Tabs>
|
|
|
|
</Tabs.Tab>
|
|
|
|
<Tabs.Tab>
|
|
|
|
If you can't or don't want to use the Context Manager, Hive Gateway provides a cross platform
|
|
context tracking mechanism.
|
|
|
|
To parent spans correctly, you will have to manually provide the current OTEL context. You can
|
|
retrieve the current OTEL context by either using the Hive Gateway OpenTelemetry API
|
|
(`@graphql-hive/gateway/opentelemetry/api`) utility function `getActiveContext` with a matcher. This
|
|
matcher is an object containing either the HTTP `request`, the GraphQL `context` or an
|
|
`executionRequest`, depending on the situation. You should always provide the most specific matcher
|
|
to get the proper context.
|
|
|
|
<Tabs items={['CLI', 'Programmatic Usage']}>
|
|
|
|
<Tabs.Tab>
|
|
|
|
```ts filename="gateway.config.ts"
|
|
import { defineConfig } from '@graphql-hive/gateway'
|
|
import { openTelemetrySetup } from '@graphql-hive/gateway/opentelemetry/setup'
|
|
import { hive } from '@graphql-hive/gateway/opentelemetry/api'
|
|
import { useGenericAuth } from '@envelop/generic-auth'
|
|
|
|
openTelemetrySetup({
|
|
contextManager: null, // Don't register any context manager
|
|
traces: { console: true },
|
|
})
|
|
|
|
export const gatewayConfig = defineConfig({
|
|
openTelemetry: {
|
|
useContextManager: false, // Make sure to disable context manager usage
|
|
traces: true,
|
|
},
|
|
plugins: () => [
|
|
useGenericAuth({
|
|
resolveUserFn: (context) => {
|
|
const otelCtx = hive.getActiveContext({ context });
|
|
|
|
// Explicitly pass the parent context as the third argument.
|
|
return hive.tracer!.startActiveSpan('users.fetch', {}, otelCtx, (span) => {
|
|
const user = await fetchUser(extractUserIdFromContext(context))
|
|
span.end();
|
|
return user
|
|
})
|
|
}
|
|
}),
|
|
],
|
|
})
|
|
```
|
|
|
|
</Tabs.Tab>
|
|
|
|
<Tabs.Tab>
|
|
|
|
```ts filename="index.ts"
|
|
import { createGatewayRuntime } from '@graphql-hive/gateway-runtime'
|
|
import { useOpenTelemetry } from '@graphql-hive/plugin-opentelemetry'
|
|
import { hive } from '@graphql-hive/plugin-opentelemetry/api'
|
|
import { openTelemetrySetup } from '@graphql-hive/plugin-opentelemetry/setup'
|
|
import { useGenericAuth } from '@envelop/generic-auth'
|
|
|
|
openTelemetrySetup({
|
|
contextManager: null, // Don't register any context manager
|
|
traces: { console: true },
|
|
})
|
|
|
|
export const gateway = createGatewayRuntime({
|
|
plugins: ctx => {
|
|
return [
|
|
useOpenTelemetry({
|
|
...ctx,
|
|
useContextManager: false, // Make sure to disable context manager usage
|
|
traces: true
|
|
}),
|
|
useGenericAuth({
|
|
resolveUserFn: (context) => {
|
|
const otelCtx = hive.getActiveContext({ context });
|
|
|
|
// Explicitly pass the parent context as the third argument.
|
|
return hive.tracer!.startActiveSpan('users.fetch', {}, otelCtx, (span) => {
|
|
const user = await fetchUser(extractUserIdFromContext(context))
|
|
span.end();
|
|
return user
|
|
})
|
|
}
|
|
}),
|
|
],
|
|
}
|
|
})
|
|
```
|
|
|
|
</Tabs.Tab>
|
|
|
|
</Tabs>
|
|
|
|
</Tabs.Tab>
|
|
|
|
</Tabs>
|
|
|
|
### Custom Span Attributes, Events and Links
|
|
|
|
You can add custom attribute to Hive Gateway's spans by using the standard `@opentelemetry/api`
|
|
package. You can use the same package to record custom
|
|
[Events](https://opentelemetry.io/docs/languages/js/instrumentation/#span-events) or
|
|
[Links](https://opentelemetry.io/docs/languages/js/instrumentation/#span-links).
|
|
|
|
This can be done by getting access to the current span.
|
|
|
|
If you have an async compatible Context Manager setup, you can use the standard OpenTelemetry API to
|
|
retrieve the current span as shown in
|
|
[OpenTelemetry documentation](https://opentelemetry.io/docs/languages/js/instrumentation/#get-the-current-span).
|
|
|
|
Otherwise, Hive Gateway provide it's own cross-runtime Context tracking mechanism. In this case, you
|
|
can use
|
|
[`trace.getSpan` standard function](https://opentelemetry.io/docs/languages/js/instrumentation/#get-a-span-from-context)
|
|
to get access to the current span.
|
|
|
|
<Tabs items={["With Context Manager", "Without Context Manager"]}>
|
|
|
|
<Tabs.Tab>
|
|
|
|
If you are using an async compatible context manager, you can simply use the standard
|
|
`@opentelemetry/api` methods, as shown in
|
|
[OpenTelemetry documentation](https://opentelemetry.io/docs/languages/js/instrumentation/#create-spans).
|
|
|
|
```ts filename="gateway.config.ts"
|
|
import { defineConfig } from '@graphql-hive/gateway'
|
|
import { openTelemetrySetup } from '@graphql-hive/gateway/opentelemetry/setup'
|
|
import { trace } from '@graphql-hive/gateway/opentelemetry/api'
|
|
import { AsyncLocalStorageContextManager } from '@opentelemetry/context-async-hooks'
|
|
import { useGenericAuth } from '@envelop/generic-auth'
|
|
|
|
openTelemetrySetup({
|
|
contextManager: new AsyncLocalStorageContextManager(),
|
|
traces: { console: true },
|
|
})
|
|
|
|
export const gatewayConfig = defineConfig({
|
|
openTelemetry: {
|
|
traces: true,
|
|
},
|
|
plugins: () => [
|
|
useGenericAuth({
|
|
resolveUserFn: (context) => {
|
|
const span = trace.getActiveSpan();
|
|
const user = await fetchUser(extractUserIdFromContext(context))
|
|
span.setAttribute('user.id', user.id);
|
|
return user
|
|
}
|
|
}),
|
|
],
|
|
})
|
|
```
|
|
|
|
</Tabs.Tab>
|
|
|
|
<Tabs.Tab>
|
|
|
|
If you can't or don't want to use the Context Manager, Hive Gateway provides a cross platform
|
|
context tracking mechanism.
|
|
|
|
You can retrieve the current OTEL context by using the Hive Gateway OpenTelemetry API
|
|
(`@graphql-hive/gateway/opentelemetry/api`) utility function `getActiveContext` with a matcher. This
|
|
matcher is an object containing either the HTTP `request`, the GraphQL `context` or an
|
|
`executionRequest`, depending on the situation. You should always provide the most specific matcher
|
|
to get the proper context.
|
|
|
|
```ts filename="gateway.config.ts"
|
|
import { defineConfig } from '@graphql-hive/gateway'
|
|
import { openTelemetrySetup } from '@graphql-hive/plugin-opentelemetry/setup'
|
|
// This package re-export official @opentelemetry/api package for ease of use
|
|
import { trace, hive } from '@graphql-hive/plugin-opentelemetry/api'
|
|
|
|
openTelemetrySetup({
|
|
contextManager: null, // Don't register any context manager
|
|
traces: { console: true },
|
|
})
|
|
|
|
export const gatewayConfig = defineConfig({
|
|
openTelemetry: {
|
|
useContextManager: false, // Make sure to disable context manager usage
|
|
traces: true,
|
|
},
|
|
plugins: () => [
|
|
useGenericAuth({
|
|
resolveUserFn: (context) => {
|
|
const user = await fetchUser(extractUserIdFromContext(context))
|
|
|
|
const otelCtx = hive.getActiveContext({ context })
|
|
const span = trace.getSpan(otelCtx)
|
|
span.setAttribute('user.id', user.id);
|
|
|
|
return user
|
|
}
|
|
}),
|
|
],
|
|
})
|
|
```
|
|
|
|
When using `hive.getActiveContext` function, you have to make sure to provide the relevant http
|
|
`request`, the graphql `context` and the `executionRequest`. The context is internally stored by
|
|
referencing those objects. Missing one of the matcher can lead to unexpected parenting.
|
|
|
|
</Tabs.Tab>
|
|
|
|
</Tabs>
|
|
|
|
#### Access root spans
|
|
|
|
Sometimes, you don't want to add the custom attribute on the current span, but on one of the root
|
|
spans (http, operation, subgraph execution).
|
|
|
|
You can access those spans by using `getHttpContext(request)`, `getOperationContext(context)` and
|
|
`getExecutionRequestContext(executionRequest)` functions from
|
|
`@graphql-hive/gateway/opentelemetry/api`.
|
|
|
|
They are also accessible under `openTelemetry` key of the graphql and configuration context, and on
|
|
the plugin. When using the graphql context, the argument is optional and functions will return the
|
|
current appropriate root context.
|
|
|
|
```ts filename="gateway.config.ts"
|
|
import { hive, trace } '@graphql-hive/gateway/opentelemetry/api'
|
|
import { defineConfig } from '@graphql-hive/gateway'
|
|
|
|
export config gatewayConfig = defineConfig({
|
|
openTelemetry: {
|
|
traces: true
|
|
},
|
|
|
|
plugin: () => [{
|
|
onRequest({ request }) {
|
|
const httpSpan = trace.getSpan(hive.getHttpContext(request))
|
|
},
|
|
onExecute({ context }) {
|
|
const operationSpan = trace.getSpan(hive.getOperationContext(context))
|
|
},
|
|
onSubgraphExecute({ executionRequest }) {
|
|
const executionRequestSpan = trace.getSpan(hive.getExecutionRequestContext(executionRequest))
|
|
},
|
|
}]
|
|
})
|
|
```
|
|
|
|
### Troubleshooting
|
|
|
|
The default behavior of the plugin is to log errors and warnings to the console.
|
|
|
|
You can customize this behavior by changing the value of the
|
|
[`OTEL_LOG_LEVEL`](https://opentelemetry.io/docs/specs/otel/configuration/sdk-environment-variables/)
|
|
environment variable on your gateway process/runtime.
|
|
|
|
In addition, you can use the stdout exporter to log the traces to the console:
|
|
|
|
<Tabs items={["CLI", 'Programmatic Usage']}>
|
|
|
|
<Tabs.Tab>
|
|
|
|
```ts filename="telemetry.ts"
|
|
import { openTelemetrySetup } from '@graphql-hive/plugin-opentelemetry/setup'
|
|
import { AsyncLocalStorageContextManager } from '@opentelemetry/context-async-hooks'
|
|
|
|
openTelemetrySetup({
|
|
contextManager: new AsyncLocalStorageContextManager(),
|
|
traces: {
|
|
console: true
|
|
}
|
|
})
|
|
```
|
|
|
|
</Tabs.Tab>
|
|
|
|
<Tabs.Tab>
|
|
|
|
```ts filename="telemetry.ts"
|
|
import { NodeSDK, tracing } from '@opentelemetry/sdk-node'
|
|
|
|
new NodeSDK({
|
|
// Use `spanProcessors` instead of `traceExporter` to avoid the default batching configuration
|
|
spanProcessors: [new tracing.SimpleSpanProcessor(new tracing.ConsoleSpanExporter())]
|
|
}).start()
|
|
```
|
|
|
|
</Tabs.Tab>
|
|
|
|
</Tabs>
|
|
|
|
This will log the traces to the console, which can be useful for debugging and troubleshooting.
|
|
|
|
## Prometheus Metrics
|
|
|
|
[Prometheus](https://www.prometheus.io/) is a utility for producing, scraping and storing metrics
|
|
from services and utilities.
|
|
|
|
You can use this feature of the gateway to expose and collect metrics from all phases of your
|
|
GraphQL execution including internal query planning and outgoing HTTP requests.
|
|
|
|
The metrics gathered are then exposed in a format that Prometheus can scrape on a regular basis on
|
|
an HTTP endpoint (`/metrics` by default).
|
|
|
|
### Usage Example
|
|
|
|
<Tabs items={["CLI", "Programmatic Usage"]}>
|
|
|
|
<Tabs.Tab>
|
|
|
|
```ts filename="gateway.config.ts"
|
|
import { defineConfig } from '@graphql-hive/gateway'
|
|
|
|
export const gatewayConfig = defineConfig({
|
|
prometheus: {
|
|
// Enable the metrics you want to expose
|
|
// The following represent the default config of the plugin.
|
|
metrics: {
|
|
graphql_gateway_fetch_duration: true,
|
|
graphql_gateway_subgraph_execute_duration: true,
|
|
graphql_gateway_subgraph_execute_errors: true,
|
|
graphql_envelop_deprecated_field: true,
|
|
graphql_envelop_request: true,
|
|
graphql_envelop_request_duration: true,
|
|
graphql_envelop_request_time_summary: true,
|
|
graphql_envelop_phase_parse: true,
|
|
graphql_envelop_phase_validate: true,
|
|
graphql_envelop_phase_context: true,
|
|
graphql_envelop_error_result: true,
|
|
graphql_envelop_phase_execute: true,
|
|
graphql_envelop_phase_subscribe: true,
|
|
graphql_envelop_schema_change: true,
|
|
graphql_yoga_http_duration: true
|
|
}
|
|
}
|
|
})
|
|
```
|
|
|
|
</Tabs.Tab>
|
|
|
|
<Tabs.Tab>
|
|
|
|
```sh npm2yarn
|
|
npm i @graphql-mesh/plugin-prometheus
|
|
```
|
|
|
|
```ts filename="index.ts"
|
|
import { createGatewayRuntime } from '@graphql-hive/gateway-runtime'
|
|
import usePrometheus from '@graphql-mesh/plugin-prometheus'
|
|
|
|
export const gateway = createGatewayRuntime({
|
|
plugins: ctx => [
|
|
usePrometheus({
|
|
...ctx,
|
|
// Enable the metrics you want to expose
|
|
// The following represent the default config of the plugin.
|
|
metrics: {
|
|
graphql_gateway_fetch_duration: true,
|
|
graphql_gateway_subgraph_execute_duration: true,
|
|
graphql_gateway_subgraph_execute_errors: true,
|
|
graphql_envelop_deprecated_field: true,
|
|
graphql_envelop_request: true,
|
|
graphql_envelop_request_duration: true,
|
|
graphql_envelop_request_time_summary: true,
|
|
graphql_envelop_phase_parse: true,
|
|
graphql_envelop_phase_validate: true,
|
|
graphql_envelop_phase_context: true,
|
|
graphql_envelop_error_result: true,
|
|
graphql_envelop_phase_execute: true,
|
|
graphql_envelop_phase_subscribe: true,
|
|
graphql_envelop_schema_change: true,
|
|
graphql_yoga_http_duration: true
|
|
}
|
|
})
|
|
]
|
|
})
|
|
```
|
|
|
|
</Tabs.Tab>
|
|
|
|
</Tabs>
|
|
|
|
You can now start your Hive Gateway and make some requests to it. The plugin will start collecting
|
|
metrics, and you can access them by visiting the `/metrics` endpoint.
|
|
|
|
In most cases, you'll need to setup a Prometheus server to scrape the metrics from your gateway, we
|
|
recommend using the official
|
|
[Prometheus Server](https://prometheus.io/docs/prometheus/latest/getting_started/) or tools like
|
|
[Vector](https://vector.dev/docs/setup/installation/).
|
|
|
|
### Grafana Dashboard
|
|
|
|
If you are using Grafana to visualize your metrics, you can
|
|
[import this pre-configured Grafana dashboard from Grafana's marketplace](https://grafana.com/grafana/dashboards/21777),
|
|
or
|
|
[you can use/import this dashboard JSON file directly](https://github.com/graphql-hive/gateway/blob/main/packages/plugins/prometheus/grafana.json)
|
|
to easily visualize the metrics for your gateway.
|
|
|
|

|
|
|
|
For additional instructions, please refer to
|
|
[Import dashboards instruction in Grafana documentation](https://grafana.com/docs/grafana/latest/dashboards/build-dashboards/import-dashboards/).
|
|
|
|
### Reported Metrics
|
|
|
|
You will find the timing of each GraphQL execution phase. If you are not familiar with the lifecycle
|
|
of a GraphQL operation in the gateway, please refer to the
|
|
[Plugin Lifecycle page](/docs/gateway/other-features/custom-plugins#plugin-lifecycle). Each plugin
|
|
hook has a corresponding metric which tracks timings as
|
|
[histograms](https://prometheus.io/docs/concepts/metric_types/#histogram) or
|
|
[summary](https://prometheus.io/docs/concepts/metric_types/#summary). You will also find some
|
|
[counters](https://prometheus.io/docs/concepts/metric_types/#counter) to track the number of
|
|
requests, errors, and other useful information.
|
|
|
|
To enable a metric, set the corresponding option to `true` in the `metrics` option's object. You can
|
|
also provide a string to customize the metric name, or an object to provide more options (see
|
|
[`siimon/prom-client` documentation](https://github.com/siimon/prom-client#custom-metrics)).
|
|
Histogram metrics can be passed an array of numbers to configure buckets.
|
|
|
|
<details>
|
|
<summary>`graphql_yoga_http_duration` (default: **enabled**, type: **Histogram**)</summary>
|
|
|
|
This metric tracks the duration of incoming (downstream) HTTP requests. It reports the time spent to
|
|
process each incoming request as a
|
|
[histogram](https://prometheus.io/docs/concepts/metric_types/#histogram).
|
|
|
|
It is useful to track the responsiveness of your gateway. A spike in this metric could indicate a
|
|
performance issue and that further investigation is needed.
|
|
|
|
Please note that this metric is not specific to GraphQL, it tracks all incoming HTTP requests.
|
|
|
|
You can use labels to have a better understanding of the requests and group them together. A common
|
|
filter is to include only `statusCode` with `200` value and `method` with `POST` (the default method
|
|
for GraphQL requests, but it can also be `GET` depending on your client setup) value to get
|
|
execution time of successful GraphQL requests only.
|
|
|
|
This metric includes some useful labels to help you identify requests and group them together.
|
|
|
|
| Label | Description |
|
|
| --------------- | --------------------------------------------------------------------------------------------------------------------------------------------------------------------------------------------------------------------------------------------------------------------------------------------------------------------------------------------------------------------------------------- |
|
|
| `method` | The HTTP method used to request the gateway endpoint.<br/><br/> Since GraphQL usually only uses `POST` requests, this can be used to filter out GraphiQL-related requests. <br/><br/> It can be any HTTP verb, including disallowed ones. Which means this metric can also be used to track malformed or malicious requests. |
|
|
| `statusCode` | The HTTP status code returned by the gateway.<br/><br/>You probably want to filter out non-`200` responses to have a view of the successful requests.<br/><br/>This can help you identify which requests are failing and why. Since GraphQL errors are returned as `200 OK` responses, this can be useful to track errors that are not related to the GraphQL, like malformed requests. |
|
|
| `operationName` | If available, the name of the GraphQL operation requested, otherwise `Anonymous`.<br/><br/>This can help you identify which operations are slow or failing.<br/><br/>We recommend you always provide an operation name to your queries and mutations to help performance analysis and bug tracking. |
|
|
| `operationType` | The type of the GraphQL operation requested. It can be one of `query`, `mutation`, or `subscription`.<br/><br/>This can help you differentiate read and write performance of the system. It can for example help understand cache impact. |
|
|
| `url` | The URL of the request. Useful to filter graphql endpoint metrics (`/graphql` by default). |
|
|
|
|
</details>
|
|
|
|
<details>
|
|
<summary>`graphql_gateway_fetch_duration` (default: **enabled**, type: **Histogram**)</summary>
|
|
|
|
This metric tracks the duration of outgoing HTTP requests. It reports the time spent on each request
|
|
made using the `fetch` function provided by the gateway. It is reported as a
|
|
[histogram](https://prometheus.io/docs/concepts/metric_types/#histogram).
|
|
|
|
This metric can provide insights into the network usage of your gateway. It does not only include
|
|
requests made to resolve GraphQL operation responses, but also include any other outgoing HTTP
|
|
requests made by the gateway or one of its plugins. It will for example include requests made to
|
|
fetch the supergraph schema from the configured Schema Registry.
|
|
|
|
These metrics include some useful labels to help you identify requests and group them together.
|
|
|
|
Since they can be heavy, `requestHeaders` and `responseHeaders` are disabled by default. You can
|
|
either set those options to `true` in the `label` configuration object to include all headers in the
|
|
label, but you can also provide a list of header names to include.
|
|
|
|
| Label | Description |
|
|
| ----------------- | ------------------------------------------------------------------------------------------- |
|
|
| `url` | The URL of the upstream request. |
|
|
| `method` | The HTTP method of the upstream request. |
|
|
| `statusCode` | The status code of the upstream response. |
|
|
| `statusText` | The status text of the upstream response. |
|
|
| `requestHeaders` | Disabled by default. A JSON encoded object containing the headers of the upstream request. |
|
|
| `responseHeaders` | Disabled by default. A JSON encoded object containing the headers of the upstream response. |
|
|
|
|
</details>
|
|
|
|
<details>
|
|
<summary>`graphql_gateway_subgraph_execute_duration` (default: **enabled**, type: **Histogram**)</summary>
|
|
|
|
This metric tracks the duration of subgraph execution. It reports the time spent on each subgraph
|
|
queries made to resolve incoming operations as a
|
|
[histogram](https://prometheus.io/docs/concepts/metric_types/#histogram).
|
|
|
|
This metric can provide insights into how the time is spent to resolve queries. It can help you
|
|
identify bottlenecks in your subgraphs.
|
|
|
|
| Label | Description |
|
|
| --------------- | ---------------------------------------------------------------------------------------------------------------------- |
|
|
| `subgraphName` | The name of the targeted subgraph. |
|
|
| `operationType` | The type of the GraphQL operation executed by the subgraph. This can be one of `query`, `mutation`, or `subscription`. |
|
|
| `operationName` | The name of the GraphQL operation executed by the subgraph. It will be `Anonymous` if no `operationName` is found. |
|
|
|
|
</details>
|
|
|
|
<details>
|
|
<summary>`graphql_gateway_subgraph_execute_errors` (default: **enabled**, type: **Counter**)</summary>
|
|
|
|
This metric tracks the number of errors that occurred during the subgraph execution. It counts all
|
|
errors found in the response returned by the subgraph execution. It is exposed as a
|
|
[counter](https://prometheus.io/docs/concepts/metric_types/#counter).
|
|
|
|
This metric can help you identify subgraphs that are failing to execute operations. It can help
|
|
identify issues with the subgraph itself or the communication between the gateway and the subgraph.
|
|
|
|
| Label | Description |
|
|
| --------------- | ---------------------------------------------------------------------------------------------------------------------- |
|
|
| `subgraphName` | The name of the targeted subgraph. |
|
|
| `operationType` | The type of the GraphQL operation executed by the subgraph. This can be one of `query`, `mutation`, or `subscription`. |
|
|
| `operationName` | The name of the GraphQL operation executed by the subgraph. It will be `Anonymous` if no `operationName` is found. |
|
|
|
|
</details>
|
|
|
|
<details>
|
|
<summary>`graphql_envelop_phase_parse` (default: **enabled**, type: **Histogram**)</summary>
|
|
|
|
This metric tracks the duration of the `parse` phase of the GraphQL execution. It reports the time
|
|
spent parsing the incoming GraphQL operation. It is reported as a
|
|
[histogram](https://prometheus.io/docs/concepts/metric_types/#histogram).
|
|
|
|
Since you don't have control over the parsing phase, this metric is mostly useful to track potential
|
|
attacks. A spike in this metric could indicate someone is trying to send malicious operations to
|
|
your gateway.
|
|
|
|
| Label | Description |
|
|
| --------------- | ------------------------------------------------------------------------------------------------------- |
|
|
| `operationType` | The type of the GraphQL operation requested. This can be one of `query`, `mutation`, or `subscription`. |
|
|
| `operationName` | The name of the GraphQL operation requested. It will be `Anonymous` if no `operationName` is found. |
|
|
|
|
</details>
|
|
|
|
<details>
|
|
<summary>`graphql_envelop_phase_validate` (default: **enabled**, type: **Histogram**)</summary>
|
|
|
|
This metric tracks the duration of the `validate` phase of the GraphQL execution. It reports the
|
|
time spent validating the incoming GraphQL operation. It is reported as a
|
|
[histogram](https://prometheus.io/docs/concepts/metric_types/#histogram).
|
|
|
|
| Label | Description |
|
|
| --------------- | ------------------------------------------------------------------------------------------------------- |
|
|
| `operationType` | The type of the GraphQL operation requested. This can be one of `query`, `mutation`, or `subscription`. |
|
|
| `operationName` | The name of the GraphQL operation requested. It will be `Anonymous` if no `operationName` is found. |
|
|
|
|
</details>
|
|
|
|
<details>
|
|
<summary>`graphql_envelop_phase_context` (default: **enabled**, type: **Histogram**)</summary>
|
|
|
|
This metric tracks the duration of the `context` phase of the GraphQL execution. It reports the time
|
|
spent building the context object that will be passed to the executors. It is reported as a
|
|
[histogram](https://prometheus.io/docs/concepts/metric_types/#histogram).
|
|
|
|
| Label | Description |
|
|
| --------------- | ------------------------------------------------------------------------------------------------------- |
|
|
| `operationType` | The type of the GraphQL operation requested. This can be one of `query`, `mutation`, or `subscription`. |
|
|
| `operationName` | The name of the GraphQL operation requested. It will be `Anonymous` if no `operationName` is found. |
|
|
|
|
</details>
|
|
|
|
<details>
|
|
<summary>`graphql_envelop_phase_execute` (default: **enabled**, type: **Histogram**)</summary>
|
|
|
|
This metric tracks the duration of the `execute` phase of the GraphQL execution. It reports the time
|
|
spent actually resolving the response of the incoming operation. This includes the gathering of all
|
|
the data from all sources required to construct the final response. It is reported as a
|
|
[histogram](https://prometheus.io/docs/concepts/metric_types/#histogram).
|
|
|
|
It is the metric that will give you the most insights into the performance of your gateway, since
|
|
this is where most of the work is done.
|
|
|
|
| Label | Description |
|
|
| --------------- | ------------------------------------------------------------------------------------------------------- |
|
|
| `operationType` | The type of the GraphQL operation requested. This can be one of `query`, `mutation`, or `subscription`. |
|
|
| `operationName` | The name of the GraphQL operation requested. It will be `Anonymous` if no `operationName` is found. |
|
|
|
|
</details>
|
|
|
|
<details>
|
|
<summary>`graphql_envelop_phase_subscribe` (default: **enabled**, type: **Histogram**)</summary>
|
|
|
|
This metric tracks the duration of the `subscribe` phase of the GraphQL execution. It reports the
|
|
time spent initiating a subscription (which doesn't include actually sending the first response). It
|
|
is reported as a [histogram](https://prometheus.io/docs/concepts/metric_types/#histogram).
|
|
|
|
It will notably include the time spent to setup upstream subscriptions with appropriate transport
|
|
for each source.
|
|
|
|
| Label | Description |
|
|
| --------------- | ------------------------------------------------------------------------------------------------------- |
|
|
| `operationType` | The type of the GraphQL operation requested. This can be one of `query`, `mutation`, or `subscription`. |
|
|
| `operationName` | The name of the GraphQL operation requested. It will be `Anonymous` if no `operationName` is found. |
|
|
|
|
</details>
|
|
|
|
<details>
|
|
<summary>`graphql_envelop_request_duration` (default: **enabled**, type: **Histogram**)</summary>
|
|
|
|
This metric tracks the duration of the complete GraphQL operation execution. It reports the time
|
|
spent in the GraphQL specific processing, excluding the HTTP-level processing. It is reported as a
|
|
[histogram](https://prometheus.io/docs/concepts/metric_types/#histogram).
|
|
|
|
| Label | Description |
|
|
| --------------- | ------------------------------------------------------------------------------------------------------- |
|
|
| `operationType` | The type of the GraphQL operation requested. This can be one of `query`, `mutation`, or `subscription`. |
|
|
| `operationName` | The name of the GraphQL operation requested. It will be `Anonymous` if no `operationName` is found. |
|
|
|
|
</details>
|
|
|
|
<details>
|
|
<summary>`graphql_envelop_request_time_summary` (default: **enabled**, type: **Summary**)</summary>
|
|
|
|
This metric provides a summary of the time spent on the GraphQL operation execution. It reports the
|
|
same timing than [`graphql_envelop_request_duration`](#graphql_envelop_request_duration) but as a
|
|
[summary](https://prometheus.io/docs/concepts/metric_types/#summary).
|
|
|
|
| Label | Description |
|
|
| --------------- | ------------------------------------------------------------------------------------------------------- |
|
|
| `operationType` | The type of the GraphQL operation requested. This can be one of `query`, `mutation`, or `subscription`. |
|
|
| `operationName` | The name of the GraphQL operation requested. It will be `Anonymous` if no `operationName` is found. |
|
|
|
|
</details>
|
|
|
|
<details>
|
|
<summary>`graphql_envelop_error_result` (default: **enabled**, type: **Counter**)</summary>
|
|
|
|
This metric tracks the number of errors that was returned by the GraphQL execution.
|
|
|
|
Similarly to [`graphql_gateway_subgraph_execute_errors`](#graphql_gateway_subgraph_execute_errors),
|
|
it counts all errors found in the final response constructed by the gateway after it gathered all
|
|
subgraph responses, but it also includes errors from other GraphQL processing phases (parsing,
|
|
validation and context building). It is exposed as a
|
|
[counter](https://prometheus.io/docs/concepts/metric_types/#counter).
|
|
|
|
Depending on the phase when the error occurred, some labels may be missing. For example, if the
|
|
error occurred during the context phase, only the `phase` label will be present.
|
|
|
|
| Label | Description |
|
|
| --------------- | --------------------------------------------------------------------------------------------------------------------------------------------------------------------- |
|
|
| `path` | The path of the field that caused the error. It can be `undefined` if the error is not related to a given field. |
|
|
| `phase` | The phase of the GraphQL execution where the error occurred. It can be `parse`, `validate`, `context`, `execute` (for every operation types including subscriptions). |
|
|
| `operationType` | The type of the GraphQL operation requested. This can be one of `query`, `mutation`, or `subscription`. |
|
|
| `operationName` | The name of the GraphQL operation requested. It will be `Anonymous` if no `operationName` is found. |
|
|
|
|
</details>
|
|
|
|
<details>
|
|
<summary>`graphql_envelop_request` (default: **enabled**, type: **Counter**)</summary>
|
|
|
|
This metric tracks the number of GraphQL operations executed. It counts all operations, either
|
|
failed or successful, including subscriptions. It is exposed as a
|
|
[counter](https://prometheus.io/docs/concepts/metric_types/#counter).
|
|
|
|
It can differ from the number reported by
|
|
[`graphql_yoga_http_duration_sum`](#graphql_yoga_http_duration) because a single HTTP request can
|
|
contain multiple GraphQL operations if batching has been enabled.
|
|
|
|
| Label | Description |
|
|
| --------------- | ------------------------------------------------------------------------------------------------------- |
|
|
| `operationType` | The type of the GraphQL operation requested. This can be one of `query`, `mutation`, or `subscription`. |
|
|
| `operationName` | The name of the GraphQL operation requested. It will be `Anonymous` if no `operationName` is found. |
|
|
|
|
</details>
|
|
|
|
<details>
|
|
<summary>`graphql_envelop_deprecated_field` (default: **enabled**, type: **Counter**)</summary>
|
|
|
|
This metric tracks the number of deprecated fields used in the GraphQL operation.
|
|
|
|
| Label | Description |
|
|
| --------------- | ------------------------------------------------------------------------------------------------------- |
|
|
| `fieldName` | The name of the deprecated field that has been used. |
|
|
| `typeName` | The name of the parent type of the deprecated field that has been used. |
|
|
| `operationType` | The type of the GraphQL operation requested. This can be one of `query`, `mutation`, or `subscription`. |
|
|
| `operationName` | The name of the GraphQL operation requested. It will be `Anonymous` if no `operationName` is found. |
|
|
|
|
</details>
|
|
|
|
<details>
|
|
<summary>`graphql_envelop_schema_change` (default: **enabled**, type: **Counter**)</summary>
|
|
|
|
This metric tracks the number of schema changes that have occurred since the gateway started. When
|
|
polling is enabled, this will include the schema reloads.
|
|
|
|
If you are using a plugin that modifies the schema on the fly, be aware that this metric will also
|
|
include updates made by those plugins. Which means that one schema update can actually trigger
|
|
multiple schema changes.
|
|
|
|
</details>
|
|
|
|
<details>
|
|
<summary>`graphql_envelop_execute_resolver` (default: **disabled**, type: **Histogram**)</summary>
|
|
|
|
<Callout type="warning">
|
|
Enabling resolvers level metrics will introduce significant overhead. It is recommended to enable
|
|
this metric only for debugging purposes.
|
|
</Callout>
|
|
|
|
This metric tracks the duration of each resolver execution. It reports the time spent only on
|
|
additional resolvers, not on fields that are resolved by a subgraph. It is up to the subgraph server
|
|
to implement resolver level metrics, the gateway can't remotely track their execution time.
|
|
|
|
| Label | Description |
|
|
| --------------- | ------------------------------------------------------------------------------------------------------- |
|
|
| `operationType` | The type of the GraphQL operation requested. This can be one of `query`, `mutation`, or `subscription`. |
|
|
| `operationName` | The name of the GraphQL operation requested. It will be `Anonymous` if no `operationName` is found. |
|
|
| `fieldName` | The name of the field being resolved. |
|
|
| `typeName` | The name of the parent type of the field being resolved. |
|
|
| `returnType` | The name of the return type of the field being resolved. |
|
|
|
|
**Filter resolvers to instrument**
|
|
|
|
To mitigate the cost of instrumenting all resolvers, you can explicitly list the fields that should
|
|
be instrumented by providing a list of field names to the `instrumentResolvers` option.
|
|
|
|
It is a list of strings in the form of `TypeName.fieldName`. For example, to instrument the `hello`
|
|
root query, you would use `Query.hello`.
|
|
|
|
You can also use wildcards to instrument all the fields for a type. For example, to instrument all
|
|
root queries, you would use `Query.*`.
|
|
|
|
</details>
|
|
|
|
### Troubleshooting
|
|
|
|
You can observe and troubleshoot the metrics by visiting the `/metrics` endpoint of your gateway.
|
|
Run your gateway and execute a few GraphQL operations to produce some metrics.
|
|
|
|
Then, use the following `curl` command will fetch the metrics from your gateway:
|
|
|
|
```sh
|
|
curl -v http://localhost:4000/metrics
|
|
```
|
|
|
|
<Callout>Change `http://localhost:4000` to the actual URL of your running gateway.</Callout>
|
|
|
|
### Customizations
|
|
|
|
<Tabs items={["Introspection Queries", "Labels", "Metric Name", "Metric Config", "Registry", "Metric Volume"]}>
|
|
|
|
<Tabs.Tab>
|
|
|
|
By default, all operations are instrumented, including introspection queries. It is possible to
|
|
ignore introspection queries for all metrics prefixed by `graphql_envelop_` by setting the
|
|
`skipIntrospection` option to `true`.
|
|
|
|
</Tabs.Tab>
|
|
|
|
<Tabs.Tab>
|
|
|
|
By default, all labels are enabled, but each one can be disabled to reduce cardinality:
|
|
|
|
```ts filename="gateway.config.ts"
|
|
const prometheusConfig = {
|
|
labels: {
|
|
url: false // remove `url` labels from all relevant metrics
|
|
}
|
|
}
|
|
```
|
|
|
|
</Tabs.Tab>
|
|
|
|
<Tabs.Tab>
|
|
|
|
By providing a string, you can change the name of the metric. For example, to change the name of the
|
|
name of the `graphql_yoga_http_duration` metric to `http_request_duration`, you would use:
|
|
|
|
```ts filename="gateway.config.ts"
|
|
const prometheusConfig = {
|
|
metrics: {
|
|
graphql_yoga_http_duration: 'http_request_duration'
|
|
}
|
|
}
|
|
```
|
|
|
|
</Tabs.Tab>
|
|
|
|
<Tabs.Tab>
|
|
|
|
By providing an object, you can customize the metric configuration. These configuration objects
|
|
should be created using the provided factories for each metric type (`createCounter`,
|
|
`createHistogram`, `createSummary`).
|
|
|
|
<Callout type="info">
|
|
By providing a custom configuration, the default configuration is completely overridden. This means
|
|
you need to provide all options, including the name and the labels.
|
|
|
|
You can look at the source code of the plugin to see the default configuration for each metric to
|
|
use it as a base.
|
|
|
|
</Callout>
|
|
|
|
Available options depend on the metric type, and full details about them can be found in the
|
|
[`siimon/prom-client` documentation](https://github.com/siimon/prom-client#custom-metric).
|
|
|
|
For example, you can customize the buckets of the `graphql_yoga_http_duration` histogram metric:
|
|
|
|
<Tabs items={["CLI", 'Programmatic Usage']}>
|
|
|
|
<Tabs.Tab>
|
|
|
|
```ts filename="gateway.config.ts"
|
|
import { register as registry } from 'prom-client'
|
|
import { createHistogram, defineConfig } from '@graphql-hive/gateway'
|
|
|
|
export const gatewayConfig = defineConfig({
|
|
prometheus: {
|
|
metrics: {
|
|
graphql_yoga_http_duration: createHistogram({
|
|
registry,
|
|
histogram: {
|
|
name: 'graphql_yoga_http_duration',
|
|
help: 'Time spent on HTTP connection',
|
|
labels: ['method', 'statusCode', 'operationName', 'operationType'],
|
|
buckets: [0.1, 5, 15, 50, 100, 500]
|
|
},
|
|
fillLabelsFn(params, { request, response }) {
|
|
return {
|
|
method: request.method,
|
|
statusCode: response.status,
|
|
operationType: params.operationType,
|
|
operationName: params.operationName || 'Anonymous'
|
|
}
|
|
}
|
|
})
|
|
// ... rest of metrics ...
|
|
}
|
|
}
|
|
})
|
|
```
|
|
|
|
</Tabs.Tab>
|
|
|
|
<Tabs.Tab>
|
|
|
|
```ts filename="index.ts"
|
|
import { register as registry } from 'prom-client'
|
|
import { createGatewayRuntime } from '@graphql-hive/gateway-runtime'
|
|
import usePrometheus, { createHistogram } from '@graphql-mesh/plugin-prometheus'
|
|
|
|
export const gateway = createGatewayRuntime({
|
|
plugins: ctx => [
|
|
usePrometheus({
|
|
...ctx,
|
|
// Enable the metrics you want to expose
|
|
// The following represent the default config of the plugin.
|
|
metrics: {
|
|
graphql_yoga_http_duration: createHistogram({
|
|
registry,
|
|
histogram: {
|
|
name: 'graphql_yoga_http_duration',
|
|
help: 'Time spent on HTTP connection',
|
|
labels: ['method', 'statusCode', 'operationName', 'operationType'],
|
|
buckets: [0.1, 5, 15, 50, 100, 500]
|
|
},
|
|
fillLabelsFn(params, { request, response }) {
|
|
return {
|
|
method: request.method,
|
|
statusCode: response.status,
|
|
operationType: params.operationType,
|
|
operationName: params.operationName || 'Anonymous'
|
|
}
|
|
}
|
|
})
|
|
// ... rest of metrics ...
|
|
}
|
|
})
|
|
]
|
|
})
|
|
```
|
|
|
|
</Tabs.Tab>
|
|
|
|
</Tabs>
|
|
|
|
</Tabs.Tab>
|
|
|
|
<Tabs.Tab>
|
|
|
|
You can customize the client's registry by passing a custom registry to the `registry` option.
|
|
|
|
```ts filename="gateway.config.ts"
|
|
import { Registry } from 'prom-client'
|
|
|
|
const myRegistry = new Registry()
|
|
|
|
const prometheusConfig = {
|
|
registry: myRegistry
|
|
}
|
|
```
|
|
|
|
</Tabs.Tab>
|
|
|
|
<Tabs.Tab>
|
|
|
|
In some cases, the large variety of label values can lead to a huge amount of metrics being
|
|
exported. To save bandwidth or storage, you can reduce the amount of reported metrics by multiple
|
|
ways.
|
|
|
|
#### Monitor only some phases
|
|
|
|
Some metrics observe events in multiple phases of the graphql pipeline. The metric with the highest
|
|
chance causing large amount of metrics is `graphql_envelop_error_result`, because it can contain
|
|
information specific to the error reported.
|
|
|
|
You can lower the amount of reported errors by changing the phases monitored by this metric.
|
|
|
|
```ts
|
|
import { execute, parse, specifiedRules, subscribe, validate } from 'graphql'
|
|
import { Registry } from 'prom-client'
|
|
import { envelop, useEngine } from '@envelop/core'
|
|
|
|
const myRegistry = new Registry()
|
|
|
|
const getEnveloped = envelop({
|
|
plugins: [
|
|
useEngine({ parse, validate, specifiedRules, execute, subscribe }),
|
|
usePrometheus({
|
|
metrics: {
|
|
// To ignore parsing and validation error, and only monitor errors happening during
|
|
// resolvers executions, you can enable only the `execute` and `subscribe` phases
|
|
graphql_envelop_error_result: ['execute', 'subscribe']
|
|
}
|
|
})
|
|
]
|
|
})
|
|
```
|
|
|
|
#### Skip observation based on request context
|
|
|
|
To save bandwidth or storage, you can reduce the amount of reported values by filtering which events
|
|
are observed based on the request context.
|
|
|
|
For example, you can only monitor a subset of operations, because they are critical or that you want
|
|
to debug it's performance:
|
|
|
|
```ts
|
|
import { execute, parse, specifiedRules, subscribe, validate } from 'graphql'
|
|
import { envelop, useEngine } from '@envelop/core'
|
|
import { usePrometheus } from '@envelop/prometheus'
|
|
|
|
const TRACKED_OPERATION_NAMES = [
|
|
// make a list of operation that you want to monitor
|
|
]
|
|
|
|
const getEnveloped = envelop({
|
|
plugins: [
|
|
useEngine({ parse, validate, specifiedRules, execute, subscribe }),
|
|
usePrometheus({
|
|
metrics: {
|
|
graphql_yoga_http_duration: createHistogram({
|
|
registry,
|
|
histogram: {
|
|
name: 'graphql_yoga_http_duration',
|
|
help: 'Time spent on HTTP connection',
|
|
labelNames: ['operation_name']
|
|
},
|
|
fillLabelsFn: ({ operationName }, _rawContext) => ({
|
|
operation_name: operationName
|
|
}),
|
|
shouldObserve: context => TRACKED_OPERATIONS.includes(context?.params?.operationName)
|
|
})
|
|
}
|
|
})
|
|
]
|
|
})
|
|
```
|
|
|
|
</Tabs.Tab>
|
|
|
|
</Tabs>
|
|
|
|
## StatsD
|
|
|
|
You can use `@graphql-mesh/plugin-statsd` plugin to collect and send metrics to Datadog's DogStatsD
|
|
and InfluxDB's Telegraf StatsD services.
|
|
|
|
```sh npm2yarn
|
|
npm i @graphql-mesh/plugin-statsd
|
|
```
|
|
|
|
Compatible with:
|
|
|
|
- Datadog's DogStatsD server
|
|
- InfluxDB's Telegraf StatsD server
|
|
- Etsy's StatsD serve
|
|
|
|
Available metrics:
|
|
|
|
- `graphql.operations.count` - the number of performed operations (including failures)
|
|
- `graphql.operations.error.count` - the number of failed operations
|
|
- `graphql.operations.latency` - a histogram of response times (in milliseconds)
|
|
- `graphql.delegations.count` - the number of delegated operations to the sources
|
|
- `graphql.delegations.error.count` - the number of failed delegated operations
|
|
- `graphql.delegations.latency` - a histogram of delegated response times (in milliseconds)
|
|
- `graphql.fetch.count` - the number of outgoing HTTP requests
|
|
- `graphql.fetch.error.count` - the number of failed outgoing HTTP requests
|
|
- `graphql.fetch.latency` - a histogram of outgoing HTTP response times (in milliseconds)
|
|
|
|
<Callout>You can also customize the `graphql` prefix and add custom tags to the metrics.</Callout>
|
|
|
|
### Usage Example
|
|
|
|
<Tabs items={["CLI", "Programmatic Usage"]}>
|
|
|
|
<Tabs.Tab>
|
|
|
|
```ts filename="gateway.config.ts"
|
|
import { defineConfig } from '@graphql-hive/gateway'
|
|
import useStatsD from '@graphql-mesh/plugin-statsd'
|
|
|
|
export const gatewayConfig = defineConfig({
|
|
plugins: pluginCtx => [
|
|
useStatsD({
|
|
...pluginCtx,
|
|
// Configure `hot-shots` if only you need. You don't need to pass this if you don't need to configure it.
|
|
client: {
|
|
port: 8020
|
|
},
|
|
// results in `my-graphql-gateway.operations.count` instead of `graphql.operations.count`
|
|
prefix: 'my-graphql-gateway',
|
|
// If you wish to disable introspection logging
|
|
skipIntrospection: true
|
|
})
|
|
]
|
|
})
|
|
```
|
|
|
|
</Tabs.Tab>
|
|
|
|
<Tabs.Tab>
|
|
|
|
```ts filename="index.ts"
|
|
import { StatsD } from 'hot-shots'
|
|
import { createGatewayRuntime } from '@graphql-hive/gateway-runtime'
|
|
import useStatsD from '@graphql-mesh/plugin-statsd'
|
|
|
|
export const gateway = createGatewayRuntime({
|
|
plugins: pluginCtx => [
|
|
useStatsD({
|
|
...pluginCtx,
|
|
// Configure `hot-shots` if only you need. You don't need to pass this if you don't need to configure it.
|
|
client: new StatsD({
|
|
port: 8020
|
|
}),
|
|
// results in `my-graphql-gateway.operations.count` instead of `graphql.operations.count`
|
|
prefix: 'my-graphql-gateway',
|
|
// If you wish to disable introspection logging
|
|
skipIntrospection: true
|
|
})
|
|
]
|
|
})
|
|
```
|
|
|
|
</Tabs.Tab>
|
|
|
|
</Tabs>
|
|
|
|
## Sentry
|
|
|
|
This plugin collects errors and performance tracing for your execution flow, and reports it to
|
|
[Sentry](https://sentry.io).
|
|
|
|
This is how it looks like in Sentry for error tracking:
|
|
|
|
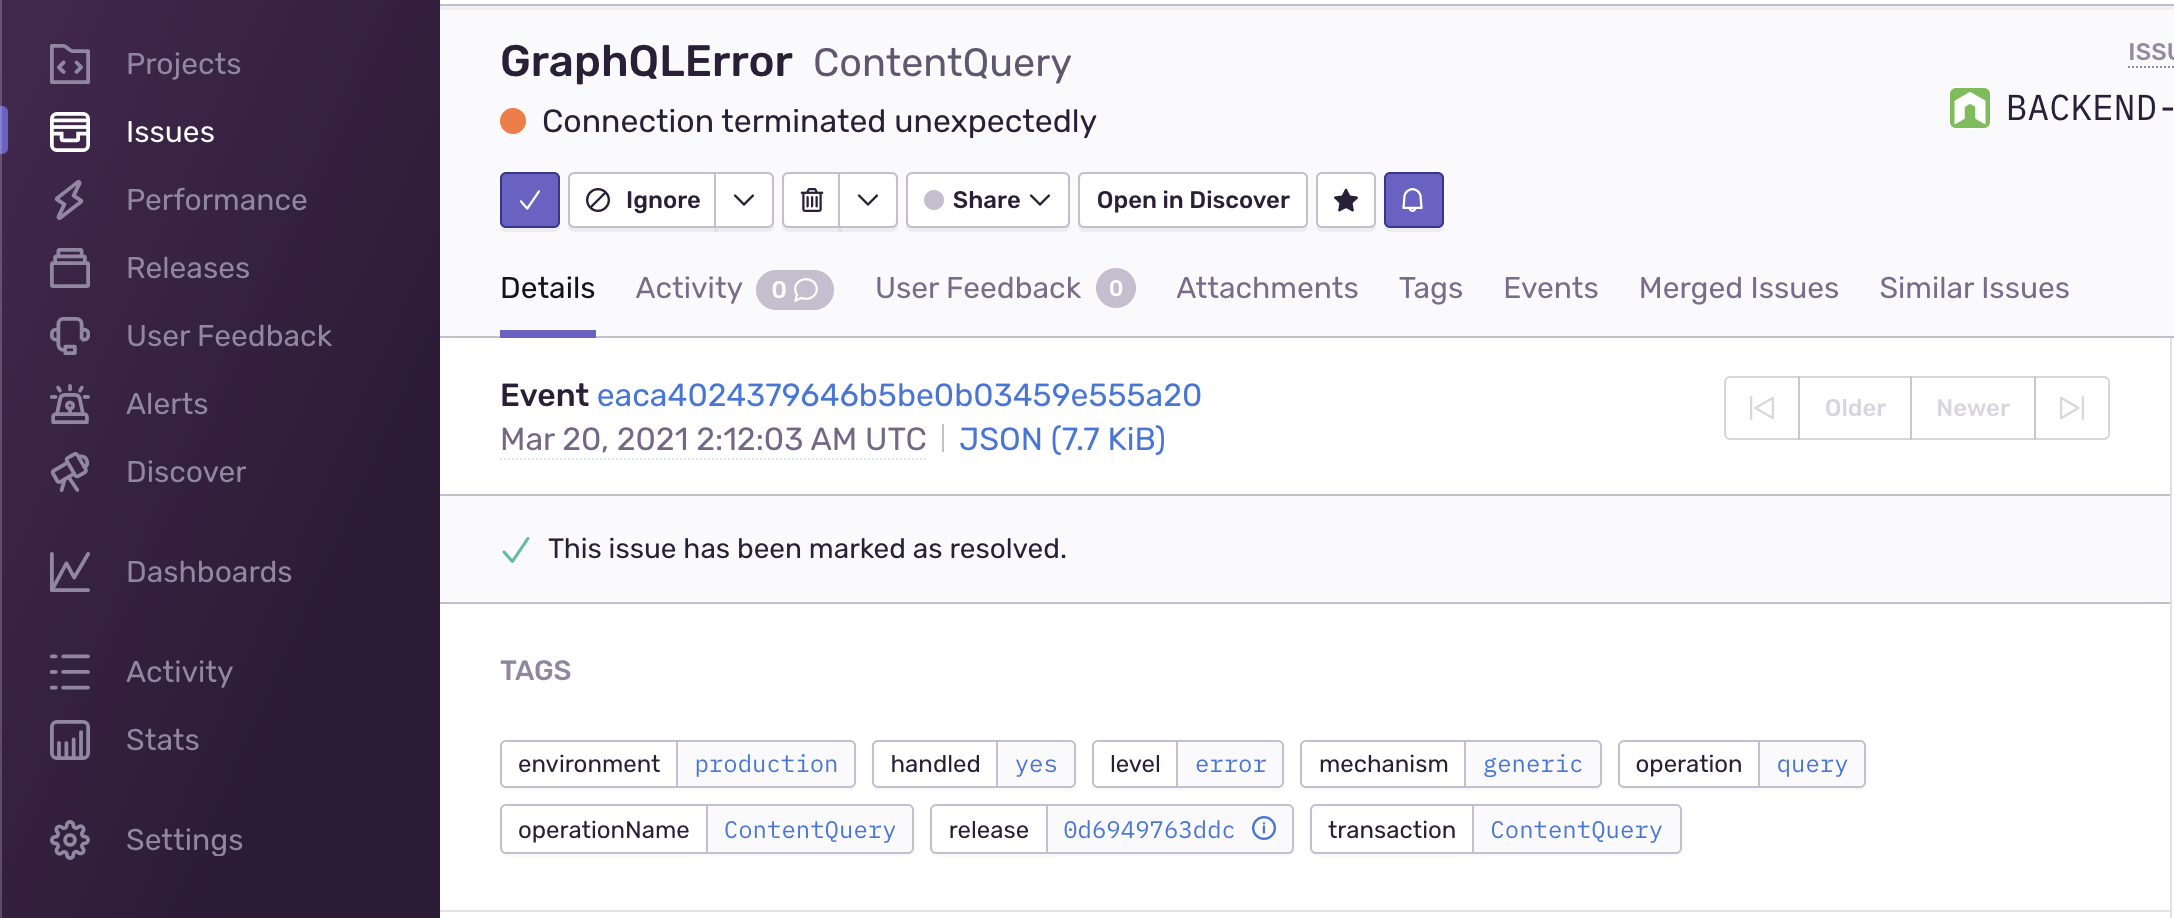
|
|
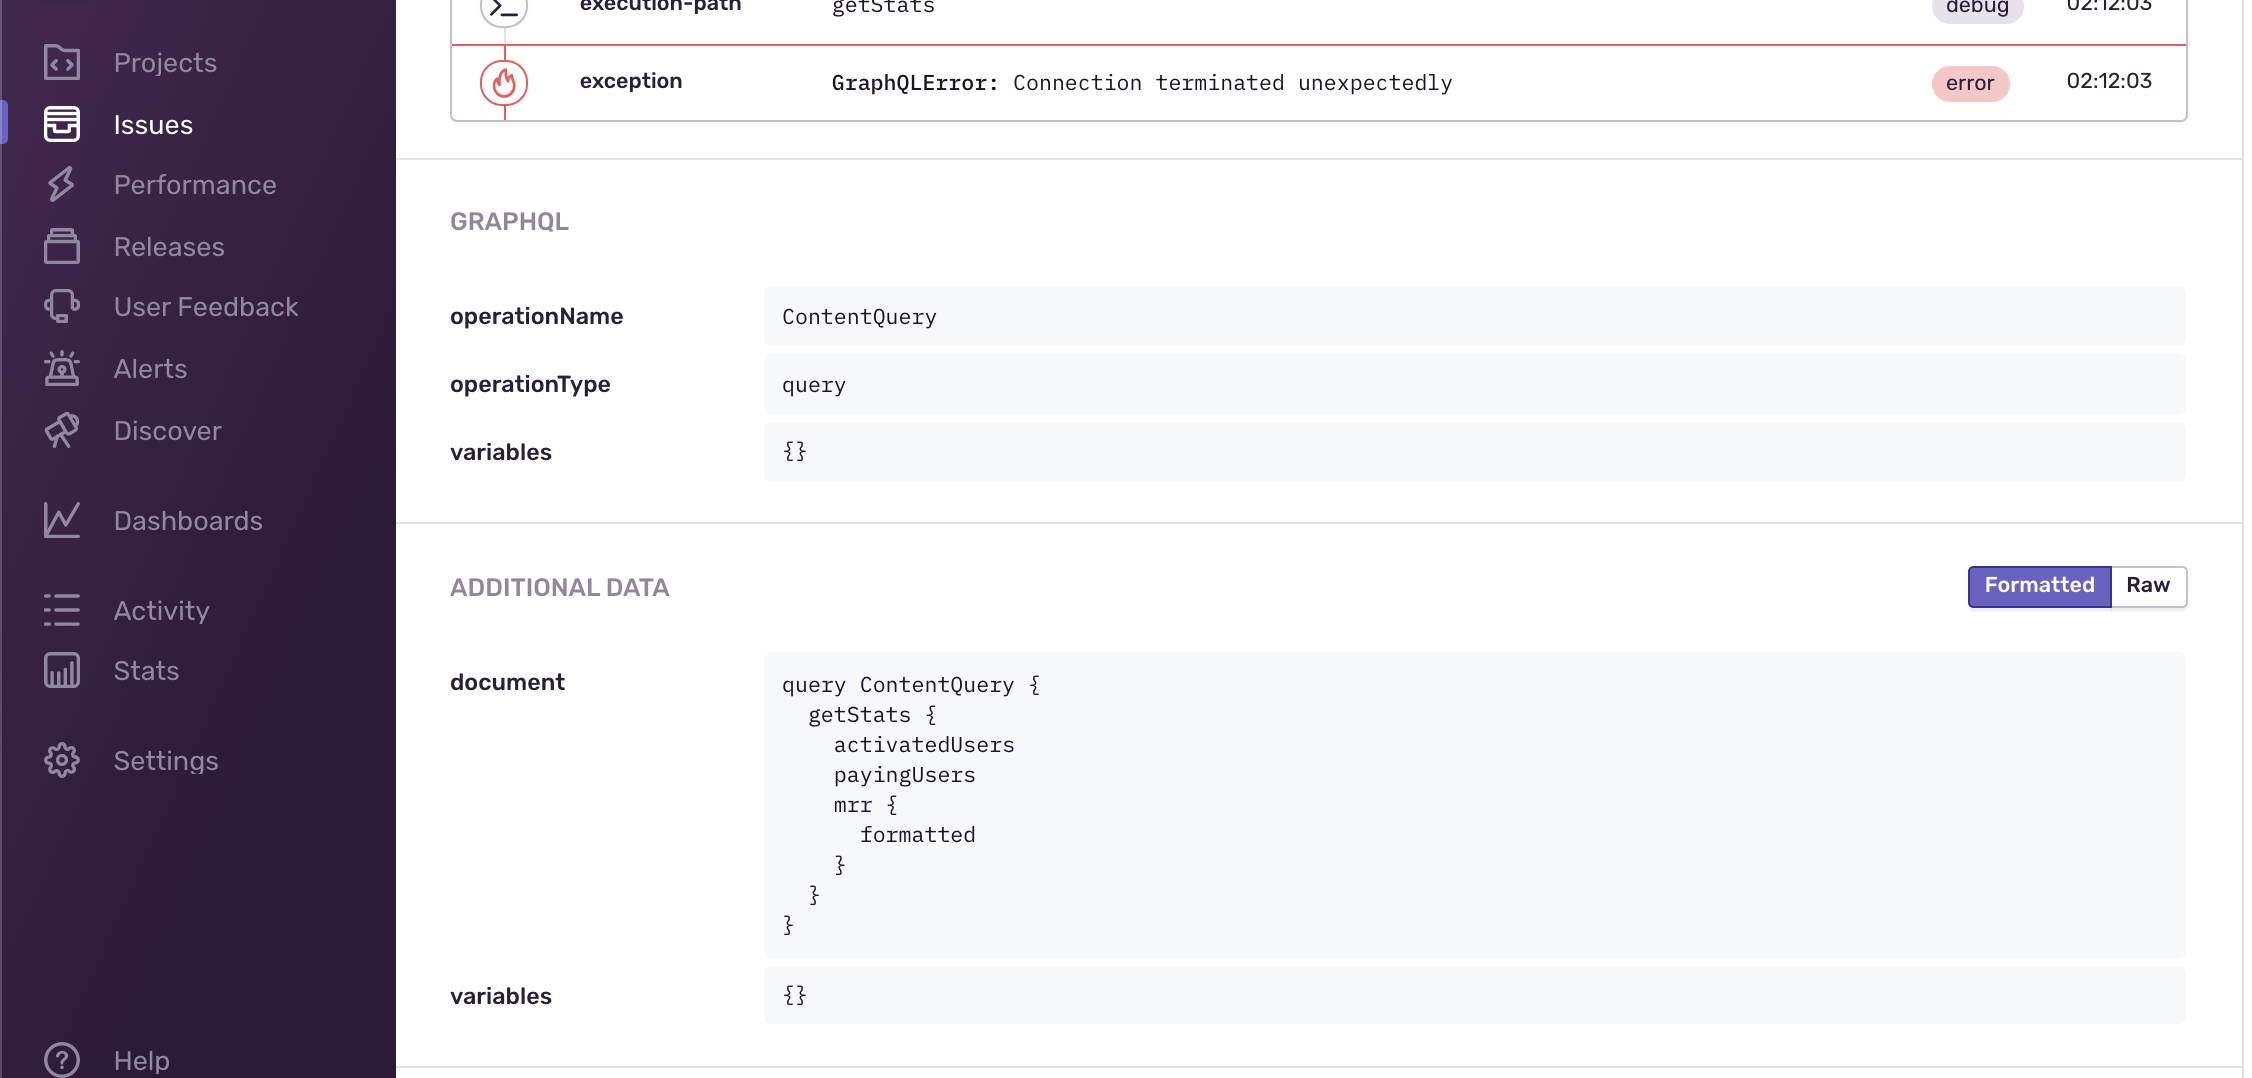
|
|
|
|
<Callout>
|
|
The operation name, document, variables are collected on errors, and the breadcrumbs that led to
|
|
the error. You can also add any custom values that you need.
|
|
</Callout>
|
|
|
|
To get started with Sentry, you need to create a new project in Sentry and get the DSN:
|
|
|
|
1. Start by creating an account and a project in https://sentry.io
|
|
2. Follow the instructions to setup your Sentry instance in your application.
|
|
3. Setup Sentry global instance configuration.
|
|
4. Setup the Envelop plugin.
|
|
|
|
Then, install the following plugin in your project:
|
|
|
|
```sh npm2yarn
|
|
npm i @sentry/node @sentry/tracing @envelop/sentry
|
|
```
|
|
|
|
### Usage Example
|
|
|
|
<Tabs items={["CLI", 'Programmatic Usage']}>
|
|
|
|
<Tabs.Tab>
|
|
|
|
```ts filename="gateway.config.ts"
|
|
import '@sentry/tracing' // import only once in you entry file!
|
|
import { useSentry } from '@envelop/sentry'
|
|
import { defineConfig } from '@graphql-hive/gateway'
|
|
|
|
export const gatewayConfig = defineConfig({
|
|
plugins: () => [
|
|
useSentry({
|
|
includeRawResult: false, // set to `true` in order to include the execution result in the metadata collected
|
|
includeResolverArgs: false, // set to `true` in order to include the args passed to resolvers
|
|
includeExecuteVariables: false, // set to `true` in order to include the operation variables values
|
|
appendTags: args => {}, // if you wish to add custom "tags" to the Sentry transaction created per operation
|
|
configureScope: (args, scope) => {}, // if you wish to modify the Sentry scope
|
|
skip: executionArgs => {} // if you wish to modify the skip specific operations
|
|
})
|
|
]
|
|
})
|
|
```
|
|
|
|
</Tabs.Tab>
|
|
|
|
<Tabs.Tab>
|
|
|
|
```ts filename="index.ts"
|
|
import '@sentry/tracing' // import only once in you entry file!
|
|
import { useSentry } from '@envelop/sentry'
|
|
import { createGatewayRuntime } from '@graphql-hive/gateway-runtime'
|
|
|
|
export const gateway = createGatewayRuntime({
|
|
plugins: () => [
|
|
useSentry({
|
|
includeRawResult: false, // set to `true` in order to include the execution result in the metadata collected
|
|
includeResolverArgs: false, // set to `true` in order to include the args passed to resolvers
|
|
includeExecuteVariables: false, // set to `true` in order to include the operation variables values
|
|
appendTags: args => {}, // if you wish to add custom "tags" to the Sentry transaction created per operation
|
|
configureScope: (args, scope) => {}, // if you wish to modify the Sentry scope
|
|
skip: executionArgs => {} // if you wish to modify the skip specific operations
|
|
})
|
|
]
|
|
})
|
|
```
|
|
|
|
</Tabs.Tab>
|
|
|
|
</Tabs>
|
|
|
|
### Configuration
|
|
|
|
- `startTransaction` (default: `true`) - Starts a new transaction for every GraphQL Operation. When
|
|
disabled, an already existing Transaction will be used.
|
|
- `renameTransaction` (default: `false`) - Renames Transaction.
|
|
- `includeRawResult` (default: `false`) - Adds result of each resolver and operation to Span's data
|
|
(available under "result")
|
|
- `includeExecuteVariables` (default: `false`) - Adds operation's variables to a Scope (only in case
|
|
of errors)
|
|
- `appendTags` - See example above. Allow you to manipulate the tags reports on the Sentry
|
|
transaction.
|
|
- `configureScope` - See example above. Allow you to manipulate the tags reports on the Sentry
|
|
transaction.
|
|
- `transactionName` (default: operation name) - Produces a name of Transaction (only when
|
|
"renameTransaction" or "startTransaction" are enabled) and description of created Span.
|
|
- `traceparentData` (default: `{}`) - Adds tracing data to be sent to Sentry - this includes
|
|
traceId, parentId and more.
|
|
- `operationName` - Produces a "op" (operation) of created Span.
|
|
- `skip` (default: none) - Produces a "op" (operation) of created Span.
|
|
- `skipError` (default: ignored `GraphQLError`) - Indicates whether or not to skip Sentry exception
|
|
reporting for a given error. By default, this plugin skips all `GraphQLError` errors and does not
|
|
report it to Sentry.
|
|
- `eventIdKey` (default: `'sentryEventId'`) - The key in the error's extensions field used to expose
|
|
the generated Sentry event id. Set to `null` to disable.
|